Monday, April 1, 2019

Cramer's lightning round: Slow and steady wins the race

SVMK Inc.: Dynamite. Fabulous quarter. A lot of people didn't react to it correctly at the beginning. When they dug down, they liked what [CEO] [Zander Lurie] had to say, and I did, too. The stock came too cheap. It should never have been down where it was."

Axsome Therapeutics Inc.: "Yeah, they got some sort of great breakthrough designation on a new drug, but we're not gonna cuff it. No how, no way, we're gonna find out what that [is] about. We have a list of homework and we better get it—maybe the dog at it."

Sprint Corp.: "No, no, no. We're sellers [of] Sprint. If you wanna play that, you gotta play T-Mobile, which is the one I've been behind the whole way. [CEO] John Legere knows I've been behind it even when he's wavered, I've been there."

NIO Inc.: "I do not want you in this stock ultimately, but I can't" tell you to sell here. "That would be a mistake."

General Electric Co.: "It does feel like it's gonna" get to "$10. I feel, look, it's [CEO] Larry Culp. He's doing his thing. It's gonna take a little while. It's not an overnight fix. He's approaching it correctly. I wouldn't touch it."

JD.com Inc.: "Maybe it goes up. To me it's a dice roll and I don't invest that way. I like to have more than dice."

American Water Works Co. Inc.: "It's been fine. I've liked that forever. I mean, I never had a problem with that one. It's just a good stock, it's slow growth. Slow and steady wins the race."

WATCH: Cramer's lightning round show chapters Cramer's lightning round: Slow and steady wins the race Cramer's lightning round: Slow and steady wins the race    3 Hours Ago | 04:09

Questions for Cramer?
Call Cramer: 1-800-743-CNBC

Want to take a deep dive into Cramer's world? Hit him up!
Mad Money Twitter - Jim Cramer Twitter - Facebook - Instagram

Questions, comments, suggestions for the "Mad Money" website? madcap@cnbc.com

Sunday, March 31, 2019

RingCentral Continues To Exceed Expectations

RingCentral (NYSE:RNG) is the market leader in UCaaS (Unified Communications As a Service), a market which is rapidly growing and shifting to the cloud.

The company continues to beat expectations, and we'll argue below that its growth is set to continue, although not surprisingly, the shares already reflect much of that growth. While we still see gains, it's perhaps best to wait for a dip in the price.

Products

You can see the company's products on its website and a little oversight what it does from the company's earnings deck:

RNG's cloud platform is the fastest growing UCaaS platform (according to Synergy) and a market leader, according to Gartner (earnings deck):

Growth

The company grows through the following:

A shift to the cloud Competitive wins Channel Ecosystem Expanding features and upsell International

The market is shifting to cloud platform solutions and away from legacy solutions. RingCentral's big contract win from the Columbia University competing against the top legacy solutions providers is simply a sign of the times. From the Q4CC:

We are seeing a dollar is shifting towards cloud communications solutions from legacy vendors in this $50 billion market. This is consistent with the recent report published by Gartner titled Cloud-Based Unified Communications and Contact Center Momentum is refocusing our Magic Quadrant research for 2019. It states that, by 2022, four cloud-based UCaaS licenses will be served for every premises base utilizers, driven by an expanding fleet of capabilities in UCaaS solutions.

Cloud platforms have crucial advantages, such as connections, scalability, expansion and a seamless user experience (for a description of the advantages and the difference with VoIP solutions, see here).

The company made two acquisitions, Connect First and Dimelo, which it used to launch its customer engagement platform RingCentral Engage. Although they don't contribute any significant amount of revenue, they're tuck-in acquisitions acquired for their platform-enhancing capabilities and further boost upsell opportunities.

The company launched other new products like its unified mobile app (Q4CC)...

...with integrated team messaging, voice and media seamlessly combined into a single application.

The channel partners is a somewhat surprising source of growth, given it is now being a $180M business growing at 80% (in Q4 y/y). Also, 70% of the company's seven-figure wins were from channel partners.

Perhaps somewhat counterintuitive, the economics are also favorable (Q4CC):

the cumulative profit dollars for channel are accretive to the business and a higher than direct for three reasons, one, is that the payback is faster, there is no other incremental material sales and marketing dollars you have to spend, and the overall churn is lower in the channel... So and then, again, cherry on top, if the channel does free up extra investment dollars for us to invest those dollars in the direct sales and marketing, which then accelerate the growth.

Management expects this 80% channel growth to continue.

The company has a blossoming ecosystem of app developers and app integrators, as well as a series of business app integrations from well-known providers like Microsoft (NASDAQ:MSFT) and Google (NASDAQ:GOOG) (NASDAQ:GOOGL). From the Q4CC:

The number of registered developers on our platform is now close to 20,000 and we have approximately 2,000 certified app integrations.

The company's international sales are still small (less than 10% of revenue), but they are growing faster than overall sales, and the company is making an effort to increase its international footprint.

RNG is already well established in the UK and Canada, but is now moving to France and Australia, for instance.

Q4 Results

Here are the highlights from the company's earnings deck:

As you can see, the company had a massive quarter, beating expectations by $8M, of which 40% materialized in the bottom line. Management argues this is an inherent leverage of the SaaS business model, driven by two forces:

Churn, which was down to single digits for the first time in the company's history. Upsell - About 40% of new bookings came from existing customers; clearly, the company's land and expand strategy is working.

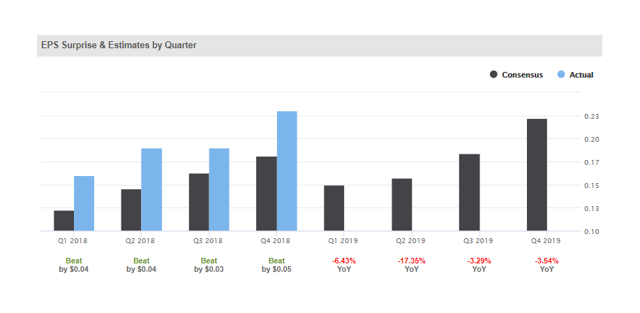
One should keep in mind that Q4 is a seasonally strong quarter for the company, although this seasonality isn't that strong. EPS beat by $0.05 and came in at $0.23, and revenue grew 34%.

Here is another look (earnings deck):

The company used to do $50M per year in business with AT&T (NYSE:T). It has re-engaged with AT&T late last year, and although management doesn't expect all that much revenue from AT&T in 2019, this has a clear potential for the future.

The company had a very good quarter getting other big customers on board as it raked in eight seven-digit TCV (total contract value) deals in Q4 (one of which was an eight-figure deal, the company's first). For the year, there were eight of these big deals, so all of them barring one arrived in Q4.

Guidance

From the earnings deck:

Management argues that the company is well on track to break the $1B revenue in 2020 and that seems a pretty reasonable assumption.

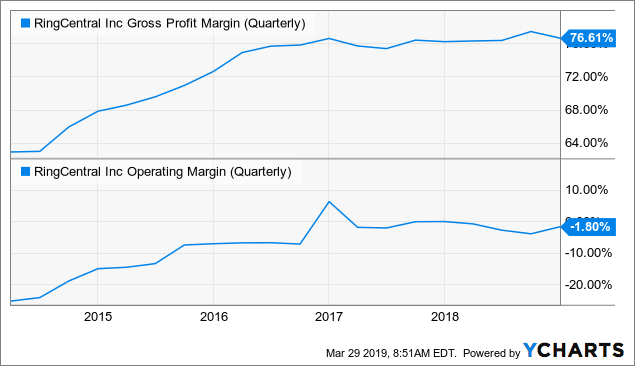
Margins

Chart Data by YCharts

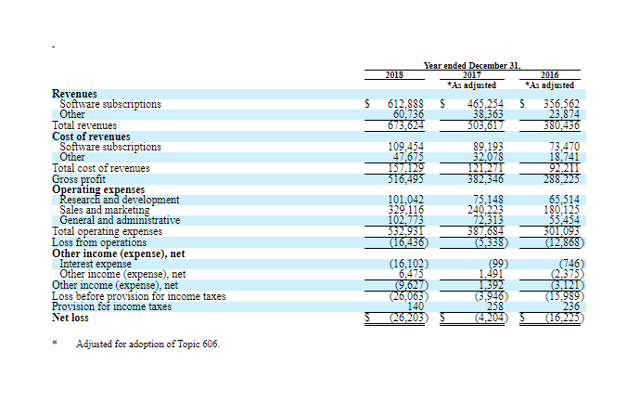
GAAP margins have trended up, although not recently. Here is a more detailed view from the 10-K:

Non-GAAP margins are considerably higher. Here is the difference for Q1:

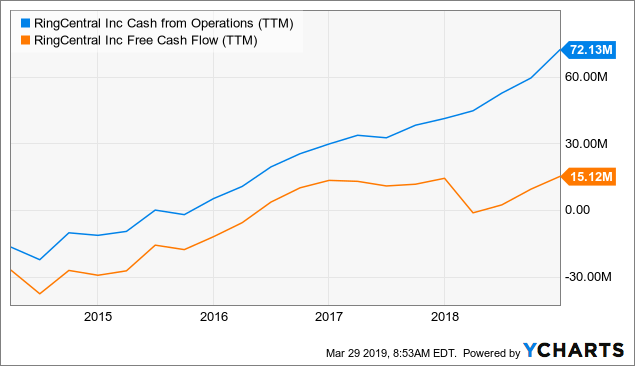
Cash

Chart Data by YCharts

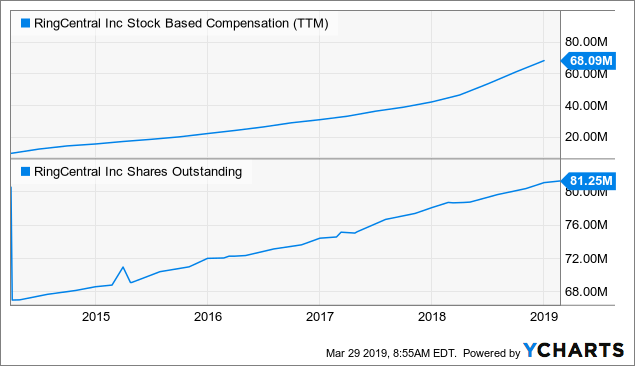
The company's cash flow has steadily improved and now solidly positive, although this is due to share-based compensation, which has also led to a considerable dilution, much of it through non-stop selling from executives (scroll down to the bottom here).

Chart Data by YCharts

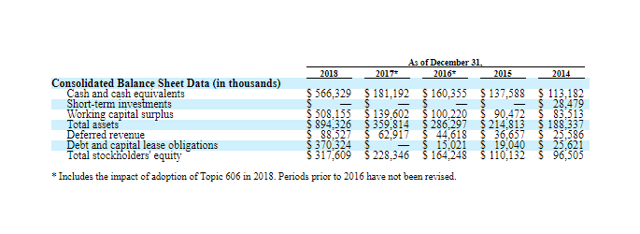
The company's balance sheet is pretty healthy. From the 10-K:

Valuation

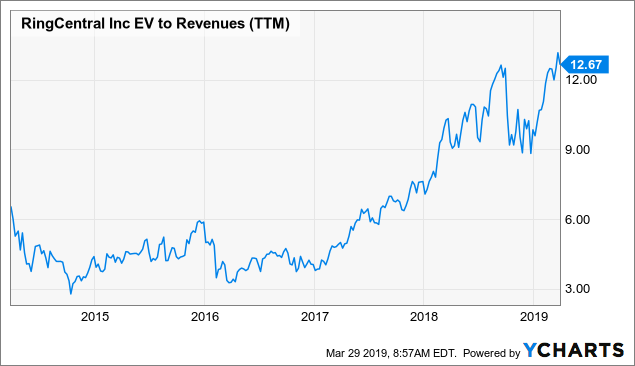
The success of the company hasn't exactly gone unnoticed:

Chart Data by YCharts

Valuation is fairly steep, although on a forward basis, that comes down to 10x sales. The company's recent earnings considerably beat analyst estimates. From SA:

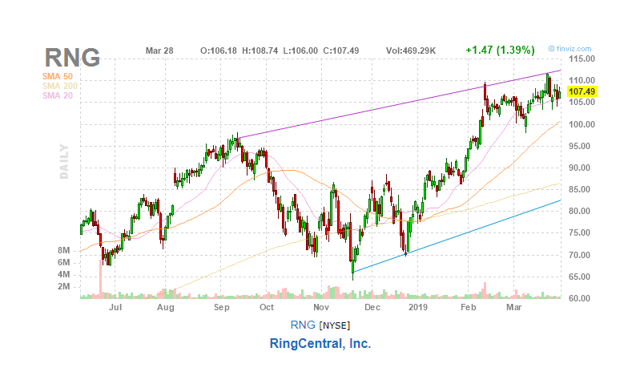
Analysts expect an EPS (non-GAAP) of $0.71 this year rising to $0.94 next year, but clearly shares are still very expensive on an earnings basis. Given the market recovery and the excellent Q4 results, the stock has been on a tear since late last year:

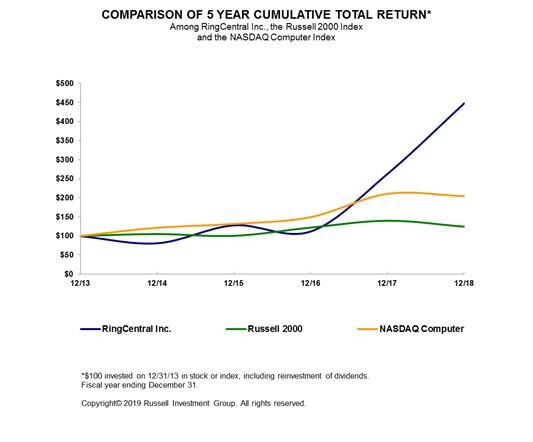
And there is a little figure in the 10-K, which is quite telling:

Conclusion

RingCentral clearly has the right products and is getting ever bigger clients. We think there is every reason to expect this growth to continue, as the company has a number of cylinders to fire on, and the market is still in the early innings with its shift to the cloud.

But RNG's shares already reflect much of that growth. We don't see room for valuation multiple expansion, and the share count is a bit of a drag on EPS growth.

The next phase will be when operational leverage turns into GAAP profits. The cash flows can be used to buy back shares, and we're not that far off.

Disclosure: I/we have no positions in any stocks mentioned, and no plans to initiate any positions within the next 72 hours. I wrote this article myself, and it expresses my own opinions. I am not receiving compensation for it (other than from Seeking Alpha). I have no business relationship with any company whose stock is mentioned in this article.

Saturday, March 30, 2019

Hot Energy Stocks For 2019

tags:AAV,NFX,SWN,OII,

In 45 years, the world has gone from energy shortage and fears of "Peak Oil" to an energy glut where it seems the world is drowning in oil and floating on a cloud of natural gas at the same time.

Yet that may not last. My models predict a long-term rise in energy demand and energy prices.

Of course, the same amount of energy has always been around. It's just a question of technology, geopolitics and price as to whether the energy gets to where it's needed when it's needed.

Hydraulic fracturing, so-called "fracking," is the biggest single factor in opening up oil supplies in the past 30 years. Oil that was always around but trapped in certain rock formations can now be released when those formations are subject to high pressure by pumping in water and sand composites.

Other innovations include horizontal as opposed to vertical drilling, so that one well can extract oil from a much larger area than before. Another rapidly growing aspect of the energy industry is the deployment of large liquefied natural gas (LNG) vessels than can move LNG across oceans instead of the gas being confined to continental areas.

Hot Energy Stocks For 2019: Advantage Oil & Gas Ltd(AAV)

Advisors' Opinion:
  • [By Max Byerly]

    Advantage Oil & Gas (NYSE:AAV) (TSE:AAV) released its quarterly earnings data on Thursday. The oil and gas company reported $0.04 EPS for the quarter, missing the Zacks’ consensus estimate of $0.07 by ($0.03), MarketWatch Earnings reports. The business had revenue of $58.07 million during the quarter, compared to analyst estimates of $62.09 million. Advantage Oil & Gas had a net margin of 39.22% and a return on equity of 2.98%.

  • [By Money Morning News Team]

    Advantage Oil & Gas Ltd. (NYSE: AAV) is a Calgary-based Canadian energy company that extracts and distributes oil. It produces approximately 35,000 barrels daily across its sites in Saskatchewan and British Columbia.

  • [By Ethan Ryder]

    Advantage Oil & Gas (NYSE:AAV) (TSE:AAV) was downgraded by analysts at Zacks Investment Research from a hold rating to a sell rating. According to Zacks, “Advantage Oil and Gas Ltd., formerly Advantage Energy Income Fund, is an intermediate oil and natural gas corporation, engaged in the exploration and development of oil and natural gas properties in Alberta and Saskatchewan in Canada. It focuses on developing the Montney natural gas resource play located at Glacier, Alberta. The Company’s properties are located in Alberta and Saskatchewan, and consist of liquids rich natural gas and light oil. The Company’s head office is located in Calgary, Alberta, Canada. “

Hot Energy Stocks For 2019: Newfield Exploration Company(NFX)

Advisors' Opinion:
  • [By VantagePoint]

    Newfield Exploration Company (NYSE: NFX) just had a bearish crossover on Friday, according to the chart. The predicted 72-hour moving average crossed below the simple 10-day moving average. If Monday's price action holds, that will serve as a confirmation the negative trend. 

  • [By Joseph Griffin]

    First Trust Advisors LP reduced its holdings in Newfield Exploration Co. (NYSE:NFX) by 18.7% in the second quarter, according to its most recent filing with the Securities & Exchange Commission. The institutional investor owned 364,503 shares of the energy company’s stock after selling 83,595 shares during the period. First Trust Advisors LP’s holdings in Newfield Exploration were worth $11,026,000 as of its most recent filing with the Securities & Exchange Commission.

  • [By Matthew DiLallo]

    However, while the entire sector looks undervalued, two sticks stand out as being insanely cheap versus their peers: EQT Corp. (NYSE:EQT) and Newfield Exploration (NYSE:NFX). Value investors will want to take a closer look at these two energy companies.

  • [By Ethan Ryder]

    Earnest Partners LLC raised its position in Newfield Exploration Co. (NYSE:NFX) by 11.4% in the 1st quarter, according to the company in its most recent filing with the Securities and Exchange Commission (SEC). The firm owned 1,084,526 shares of the energy company’s stock after purchasing an additional 110,630 shares during the period. Earnest Partners LLC owned 0.54% of Newfield Exploration worth $26,484,000 at the end of the most recent reporting period.

Hot Energy Stocks For 2019: Southwestern Energy Company(SWN)

Advisors' Opinion:
  • [By Logan Wallace]

    New York State Teachers Retirement System lessened its stake in Southwestern Energy (NYSE:SWN) by 3.0% in the 2nd quarter, Holdings Channel reports. The institutional investor owned 653,178 shares of the energy company’s stock after selling 19,888 shares during the quarter. New York State Teachers Retirement System’s holdings in Southwestern Energy were worth $3,462,000 as of its most recent SEC filing.

  • [By Max Byerly]

    Southwestern Energy (NYSE: SWN) and WPX Energy (NYSE:WPX) are both mid-cap oils/energy companies, but which is the superior investment? We will contrast the two companies based on the strength of their valuation, earnings, analyst recommendations, dividends, risk, profitability and institutional ownership.

  • [By Logan Wallace]

    Southwestern Energy (NYSE:SWN) had its price objective upped by analysts at Macquarie from $5.00 to $5.75 in a report released on Thursday. The brokerage presently has a “neutral” rating on the energy company’s stock. Macquarie’s target price indicates a potential upside of 19.05% from the stock’s current price.

  • [By Ethan Ryder]

    BlueMountain Capital Management LLC boosted its holdings in Southwestern Energy (NYSE:SWN) by 290.0% in the 2nd quarter, according to its most recent Form 13F filing with the Securities & Exchange Commission. The fund owned 167,089 shares of the energy company’s stock after purchasing an additional 124,248 shares during the period. BlueMountain Capital Management LLC’s holdings in Southwestern Energy were worth $886,000 at the end of the most recent reporting period.

  • [By Money Morning News Team]

    Southwestern Energy Co. (NYSE: SWN) specializes in the extraction of natural gas in areas spread throughout North America.

    Southwestern has rights to drill in more than 918,000 acres across Pennsylvania and West Virginia, the energy-rich area of the Appalachian Basin.

Hot Energy Stocks For 2019: Oceaneering International, Inc.(OII)

Advisors' Opinion:
  • [By Shane Hupp]

    Oceaneering International (NYSE:OII) shot up 3.5% on Monday . The stock traded as high as $24.97 and last traded at $23.65. 84,481 shares changed hands during mid-day trading, a decline of 93% from the average session volume of 1,156,536 shares. The stock had previously closed at $24.52.

  • [By Ethan Ryder]

    Oceaneering International (NYSE:OII) was the recipient of some unusual options trading activity on Monday. Stock traders purchased 833 put options on the stock. This is an increase of approximately 1,415% compared to the average daily volume of 55 put options.

  • [By Matthew DiLallo]

    The fourth quarter was brutal for the oil industry, as oil prices crashed 40% from their peak in early October. While that slump in the oil market had an impact on land-based drilling activities, it didn't spill over into the offshore segment, because those projects have much longer lead times. That meant Oceaneering International's (NYSE:OII) fourth-quarter results were able to improve both year over year and sequentially. The company anticipates that contract wins throughout 2018 will drive its results higher in 2019. 

Friday, March 22, 2019

Three Best Gambling Stocks to Own Right Now

This site uses Akismet to reduce spam. Learn how your comment data is processed.

The gambling industry is red-hot, and that's creating new opportunities for investors to make money on the best gambling stocks right now.

This week, shares of Caesars Entertainment Corp. (NASDAQ: CZR) were in motion on news the gambling giant might merge with Eldorado Resorts Inc. (NASDAQ: ERI).

The deal would continue a wave of consolidation in the gambling space.

Activist investor Carl Icahn, Caesars' biggest shareholder, has nearly doubled his stake in the company in anticipation of the merger, from 9.8% to 17.8%. It would be wise to follow his money, since he's known for a hot hand when it comes to these kinds of deals.

And you'll also want to follow his hot hand by jumping into the top gambling stocks right now.

Personally, I use the Money Morning Stock VQScore™ to identify the stocks with the most breakout potential.

As an economist and avid analyst in the sports gambling business, I've used the VQScore to identify double- and triple-digit winners. Last summer, we told investors about Dover Downs Gaming & Entertainment Inc. (NYSE: DDE) when the stock had a perfect VQScore of 4.75. Within weeks, it shot up more than 107% on news it had sold to a Rhode Island casino operator.

We've found even more opportunities in the hot gambling sector right now.

This week, three of the best gambling stocks in the business hit our "Buy Zone," meaning they had scores of 4 or higher.

Here's our first, expecting double-digit earnings growth next year.

Gambling Stock to Own, No. 1: Monarch Casino & Resort

Monarch Casino & Resort Inc. (NASDAQ: MCRI) is the first gambling stock on our list, with a VQScore of 4.15. This is not a company that many analysts on Wall Street cover, which makes it the perfect sneaky play to capture double-digit gains in the coming months.

Monarch is a holding company that owns and operates two casinos in Reno, Nev., and Black Hawk, Colo.

Every time I return to Reno, it seems Monarch is building market share. But a focus on its newest Black Hawk casino expansion west of Denver has generated the most buzz about the company.

Act Now: Our new book could help you quadruple your monthly income, and we're ready to send it to you immediately, for free – but only 1,000 copies are available today. Read more…

Casino operators require an influx of population growth to sustain their profitability and bottom line.

The Colorado population grew by 80,000 from 2017 to 2018, making it the seventh fastest-growing state in the U.S. The Black Hawk location is expected to be completed in late 2019, which analysts project will help grow Monarch earnings by 36.7% the following year.

With people flocking to the Denver region and a moderately strong balance sheet, Monarch can choose to be a buyer or a seller as the wave of gambling consolidation continues.
Our next gambling stock to own is also a Nevada-based resort, and it could easily jump 20% in price by the end of 2019.

Gambling Stock to Own, No. 2: Red Rocks Resorts

When the Supreme Court struck down a federal ban on sports gambling, states rushed to legalize the lucrative industry. At the time, most analysts were hawking the big names in the space – the multinational firms like Wynn Resorts Ltd. (NASDAQ: WYNN) and Las Vegas Sands Corp. (NYSE: LVS).

Instead, we focused on regional banks that offered far more upside, even if that meant staying in the local Las Vegas market. Firms like Nevada Gold & Casinos Inc. (NYSE: UWN) come to mind.

Another name to know in Nevada: Red Rocks Resorts Inc. (NYSE: RRR), the firm behind Station Casinos.

Station owns and operates 10 major gaming and entertainment facilities and 10 smaller casinos in the Las Vegas regional market. It also manages Graton Resort & Casino, an Indian casino in Sonoma County, Calif.

According to TipRanks, RRR stock is rated a "Strong Buy" with a consensus price target of $30.25. That figure represents an upside of 14.1% from Thursday's closing price.

But analysts might be underestimating RRR as a takeover target in the year ahead. No matter what, with a perfect VQScore of 4.75, a 20% jump in this stock wouldn't be surprising by the end of the year.

But this next one might be our fastest-growing gambling stock to buy.

It happens to be a name-brand operator still flying under Wall Street's radar…

Join the conversation. Click here to jump to comments…

Tuesday, March 19, 2019

Best Safest Stocks To Buy Right Now

tags:EQIX,WRE,DAIO,LPSN,OMEX,RDC, President Trump took credit Tuesday for "the safest year on record" for U.S. air travel, touting zero deaths in 2017. But there actually haven't been any deaths on a U.S. passenger airline in nearly nine years.

Still, the president took credit for the safety record in a tweet.

"Since taking office I have been very strict on Commercial Aviation. Good news -- it was just reported that there were Zero deaths in 2017, the best and safest year on record!"

There were fatal crashes of commercial planes last year, but they all involved non-U.S. carriers operating overseas. Even after taking those crashes into account, 2017 was still the safest year on record for air travel worldwide.

Since taking office I have been very strict on Commercial Aviation. Good news - it was just reported that there were Zero deaths in 2017, the best and safest year on record!

— Donald J. Trump (@realDonaldTrump) January 2, 2018

The last fatal accident involving a commercial U.S. passenger airline flight was in February 2009, when Colgan Air 3407 crashed in wintery conditions while on approach in Buffalo, killing 49 aboard and one person on the ground.

Best Safest Stocks To Buy Right Now: Equinix Inc.(EQIX)

Advisors' Opinion:
  • [By Joseph Griffin]

    Morgan Stanley cut its stake in Equinix Inc (NASDAQ:EQIX) by 1.9% in the second quarter, Holdings Channel reports. The institutional investor owned 137,040 shares of the financial services provider’s stock after selling 2,604 shares during the period. Morgan Stanley’s holdings in Equinix were worth $58,912,000 at the end of the most recent quarter.

  • [By Craig Jones]

    Kevin Kelly spoke on Bloomberg Markets about a bullish options trade in Equinix Inc (NASDAQ: EQIX).

    He wants to buy the September 400/450 call spread in the name for $15.50. The trade breaks even at $415.50 or 5.41 percent above the current market price. It can maximally make a profit of $34.50. The payoff ratio is roughly 2.5 to 1, explained Kelly. He sees this as a derivative play on Microsoft Corporation's (NASDAQ: MSFT) cloud computing.

  • [By Beth McKenna]

    Equinix (NASDAQ:EQIX) reported fourth-quarter and full-year 2018 results after the market close on Wednesday. 

    The market's initial reaction was muted, with shares down by 0.2% in after-hours trading on Wednesday. Shares have returned 11.2% in 2019 through the regular trading session on Wednesday, slightly edging out the S&P 500's 10.1% return.

  • [By Lee Jackson]

    This is one of the larger cap data center companies and a top pick at Merrill Lynch. Equinix Inc. (NASDAQ: EQIX) provides data center services to protect and connect the information assets for the enterprises, financial services companies, and content and network providers primarily in the Americas, Europe, the Middle East, Africa and the Asia-Pacific.

  • [By Shane Hupp]

    Here are some of the media stories that may have impacted Accern Sentiment Analysis’s rankings:

    Get Equinix alerts: Equinix Inc (EQIX) Insider Charles J. Meyers Sells 400 Shares (americanbankingnews.com) Equinix Selects AT&T as 2018 Americas Partner of the Year (finance.yahoo.com) Equinix Inc (EQIX) Expected to Post Quarterly Sales of $1.26 Billion (americanbankingnews.com) Zacks: Analysts Anticipate Equinix Inc (EQIX) Will Announce Earnings of $5.10 Per Share (americanbankingnews.com) NetActuate Deployment to Equinix SP3 IBX® Data Center in Brazil Brings Faster Connections and New Services in … (benzinga.com)

    Several research analysts have commented on the stock. BidaskClub downgraded shares of Equinix from a “hold” rating to a “sell” rating in a research report on Friday, June 8th. Credit Suisse Group set a $525.00 price objective on shares of Equinix and gave the company a “buy” rating in a research report on Thursday, May 31st. Deutsche Bank lowered their price objective on shares of Equinix from $550.00 to $540.00 and set a “buy” rating for the company in a research report on Thursday, May 31st. ValuEngine downgraded shares of Equinix from a “hold” rating to a “sell” rating in a research report on Thursday, May 3rd. Finally, Zacks Investment Research upgraded shares of Equinix from a “sell” rating to a “hold” rating in a research report on Tuesday, May 8th. Two research analysts have rated the stock with a sell rating, three have issued a hold rating and eighteen have issued a buy rating to the company. The company currently has a consensus rating of “Buy” and an average target price of $504.29.

  • [By Lee Jackson]

    This is one of the larger cap companies in the data center arena and a top play for more conservative accounts. Equinix Inc. (NASDAQ: EQIX) provides data center services to protect and connect the information assets for the enterprises, financial services companies, and content and network providers primarily in the Americas, Europe, the Middle East, Africa and the Asia-Pacific.

Best Safest Stocks To Buy Right Now: Washington Real Estate Investment Trust(WRE)

Advisors' Opinion:
  • [By Dan Caplinger]

    The stock market lost ground on Monday, as investors appeared to have second thoughts about the future of the U.S. economy even as trade negotiations with China appear to be going well. The Dow Jones Industrial Average had been down by more than 400 points earlier in the session before recovering to finish lower by just 207, and broader benchmarks saw more modest declines on a percentage basis. Even amid the carnage, there was some good news for certain companies. Washington Real Estate Investment Trust (NYSE:WRE), Ascendis Pharma (NASDAQ:ASND), and Bluegreen Vacations (NYSE:BXG) were among the top performers. Here's why they did so well.

  • [By Stephan Byrd]

    Shares of Washington Real Estate Investment Trust (NYSE:WRE) have been assigned an average rating of “Hold” from the nine brokerages that are covering the firm, Marketbeat reports. Two investment analysts have rated the stock with a sell rating, two have given a hold rating and four have given a buy rating to the company. The average twelve-month price target among analysts that have covered the stock in the last year is $31.33.

  • [By Ethan Ryder]

    Washington Real Estate Investment Trust (NYSE:WRE) has received a consensus rating of “Hold” from the eight ratings firms that are covering the company, Marketbeat.com reports. One equities research analyst has rated the stock with a sell rating, three have issued a hold rating and three have issued a buy rating on the company. The average 12 month price target among analysts that have covered the stock in the last year is $29.75.

  • [By Ethan Ryder]

    Get a free copy of the Zacks research report on Washington Real Estate Investment Trust (WRE)

    For more information about research offerings from Zacks Investment Research, visit Zacks.com

  • [By Logan Wallace]

    Get a free copy of the Zacks research report on Washington Real Estate Investment Trust (WRE)

    For more information about research offerings from Zacks Investment Research, visit Zacks.com

Best Safest Stocks To Buy Right Now: Data I/O Corporation(DAIO)

Advisors' Opinion:
  • [By Ethan Ryder]

    Analogic (NASDAQ: ALOG) and Data I/O (NASDAQ:DAIO) are both small-cap computer and technology companies, but which is the better stock? We will contrast the two companies based on the strength of their analyst recommendations, valuation, institutional ownership, risk, earnings, dividends and profitability.

  • [By Lisa Levin]

    Check out these big penny stock gainers and losers

    Losers World Fuel Services Corporation (NYSE: INT) tumbled 18 percent to $22.90 following Q1 results. Biglari Holdings Inc. (NYSE: BH) fell 17.4 percent to $349.52. Washington Prime Group will replace Biglari Holdings in the S&P SmallCap 600 on Tuesday, May 1. Flex Ltd. (NASDAQ: FLEX) dipped 15.7 percent to $14.03 after a mixed fourth quarter report. FormFactor, Inc. (NASDAQ: FORM) fell 15.3 percent to $11.65. FormFactor is expected to release Q1 results on May 2. Data I/O Corporation (NASDAQ: DAIO) dropped 14.3 percent to $6.24 following Q1 results. National Instruments Corporation (NASDAQ: NATI) fell 14.3 percent to $ 42.34 after reporting Q1 results. United States Steel Corporation (NYSE: X) dipped 14.2 percent to $32.37 following Q1 results. Civeo Corporation (NYSE: CVEO) dropped 13.5 percent to $3.33. Civeo posted a Q1 loss of $0.42 per share on sales of $101.504 million. athenahealth, Inc. (NASDAQ: ATHN) fell 12.4 percent to $125.310 after reporting Q1 results. Charter Communications, Inc. (NASDAQ: CHTR) shares tumbled 12.1 percent to $262.06 as the company posted Q1 results. Value Line, Inc. (NASDAQ: VALU) fell 11.3 percent to $19.10. Federated Investors, Inc. (NYSE: FII) shares dropped 11.2 percent to $27.605 after the company posted downbeat quarterly earnings. AV Homes, Inc. (NASDAQ: AVHI) declined 10.7 percent to $17.20 following Q1 results. CalAmp Corp. (NASDAQ: CAMP) dropped 9.4 percent to $21.01 after reporting Q4 results. Tandem Diabetes Care, Inc. (NASDAQ: TNDM) shares fell 8.9 percent to $7.280 following mixed Q1 results. Sony Corporation (NYSE: SNE) shares fell 8.4 percent to $45.97 after reporting Q4 results. LogMeIn Inc (NASDAQ: LOGM) fell 8.2 percent to $109.825. LogMeIn reported upbeat earnings for its first quarter, but issued weak second quarter and FY18 earning guidance. Eleven Biotherapeutics, Inc. (NASDAQ: EBIO
  • [By Lisa Levin]

    Shares of Data I/O Corporation (NASDAQ: DAIO) were down 16 percent to $6.12 following Q1 results.

    Flex Ltd. (NASDAQ: FLEX) was down, falling around 15 percent to $14.20 after a mixed fourth quarter report.

  • [By Stephan Byrd]

    Itron (NASDAQ: ITRI) and Data I/O (NASDAQ:DAIO) are both computer and technology companies, but which is the better stock? We will compare the two businesses based on the strength of their dividends, analyst recommendations, valuation, earnings, risk, institutional ownership and profitability.

Best Safest Stocks To Buy Right Now: LivePerson Inc.(LPSN)

Advisors' Opinion:
  • [By Ethan Ryder]

    LivePerson (NASDAQ: LPSN) and AppFolio (NASDAQ:APPF) are both computer and technology companies, but which is the superior stock? We will compare the two businesses based on the strength of their analyst recommendations, valuation, profitability, institutional ownership, risk, dividends and earnings.

  • [By Joseph Griffin]

    LivePerson (NASDAQ:LPSN) released its quarterly earnings results on Thursday. The technology company reported $0.01 EPS for the quarter, Bloomberg Earnings reports. LivePerson had a negative return on equity of 2.93% and a negative net margin of 6.95%. The company had revenue of $58.24 million for the quarter, compared to analysts’ expectations of $57.22 million. During the same period in the prior year, the firm earned $0.01 earnings per share. The firm’s revenue was up 14.4% compared to the same quarter last year. LivePerson updated its Q2 guidance to $0.00-0.01 EPS and its FY18 guidance to $0.11-0.15 EPS.

  • [By ]

    Sitting right in the middle of this esteemed group, LivePerson (Nasdaq: LPSN), a technology company transforming the way customers communicate with brands (and vice versa), is trading not only near its 52-week high but also near its all-time highs. And since I added the stock to our Game-Changing Stocks portfolio on December 21, and we're already up more than 60%.

  • [By Rick Munarriz]

    Shares of LivePerson (NASDAQ:LPSN) hit all-time highs on Thursday after posting fresh financial results following Wednesday's market close. The record day didn't start out that way. The provider of high-tech customer support initially opened lower following its second-quarter report, as bears fretting about LivePerson's reduced bottom-line guidance for the whole year seemed to have the upper hand over the bulls cheering on a boost to its top-line outlook. The pessimism didn't last long.

  • [By Joseph Griffin]

    Get a free copy of the Zacks research report on LivePerson (LPSN)

    For more information about research offerings from Zacks Investment Research, visit Zacks.com

Best Safest Stocks To Buy Right Now: Odyssey Marine Exploration Inc.(OMEX)

Advisors' Opinion:
  • [By Joseph Griffin]

    News stories about Odyssey Marine Exploration (NASDAQ:OMEX) have trended somewhat positive recently, according to Accern. The research firm identifies positive and negative news coverage by reviewing more than 20 million blog and news sources. Accern ranks coverage of publicly-traded companies on a scale of negative one to one, with scores closest to one being the most favorable. Odyssey Marine Exploration earned a media sentiment score of 0.01 on Accern’s scale. Accern also assigned media coverage about the business services provider an impact score of 46.3184749361846 out of 100, indicating that recent news coverage is somewhat unlikely to have an effect on the stock’s share price in the next several days.

  • [By Joseph Griffin]

    Kenon (NYSE: KEN) and Odyssey Marine Exploration (NASDAQ:OMEX) are both small-cap utilities companies, but which is the superior business? We will contrast the two businesses based on the strength of their profitability, valuation, analyst recommendations, earnings, institutional ownership, risk and dividends.

  • [By Max Byerly]

    Odyssey Marine Exploration (NASDAQ: OMEX) and Teekay Offshore Partners (NYSE:TOO) are both small-cap transportation companies, but which is the better investment? We will compare the two businesses based on the strength of their dividends, risk, analyst recommendations, profitability, institutional ownership, valuation and earnings.

  • [By Money Morning Staff Reports]

    After looking at this week's penny stock gainers, we'll give you that leg up with one of our top-rated penny stocks from our proprietary stock ranking system…

    Penny Stock Current Share Price (March 26) Last Week's Gain Cartesian Inc. (OTCMKTS: CRTN) $0.39 170.69% Odyssey Marine Exploration Inc. (Nasdaq: OMEX) $8.76 135.90% iFresh Inc. (Nasdaq: IFMK) $8.25 64.64% China Auto Logistics Inc. (Nasdaq: CALI) $4.68 47.43% National American University Holdings Inc. (Nasdaq: NAUH) $1.20 39.29% Document Security Systems Inc. (NYSE: DSS) $1.58 33.91% Blonder Tongue Labs Inc. (NYSE: BDR) $0.77 33.90% CareDx Inc. (Nasdaq: CDNA) $7.49 29.88% Mediwound Ltd. (Nasdaq: MDWD) $5.10 26.51% New York & Co. Inc. (NYSE: NWY) $3.37 26.35%

    Don't Miss This Shot at a $78,000 Windfall: This tiny firm is about to make the entire world wire-free. As its game-changing technology revolutionizes the global power structure, its stock could hand investors a massive return. Learn more…

Best Safest Stocks To Buy Right Now: Rowan Companies Inc.(RDC)

Advisors' Opinion:
  • [By Shane Hupp]

    Rowan Companies (NYSE:RDC) was downgraded by analysts at HSBC Holdings plc from a buy rating to a hold rating.

    Roper Technologies (NYSE:ROP) was downgraded by analysts at JPMorgan Chase & Co. from an overweight rating to a neutral rating.

  • [By Travis Hoium, Jason Hall, and Matthew DiLallo]

    And while offshore still has a ways to go, I think investors should do well to buy Ensco at current prices. At recent prices, its shares trade for about 24% of tangible book value. Furthermore, it's also a 23% discount to the book value of Rowan Companies (NYSE:RDC), which will merge with Ensco sometime in the first half of the year. It's a substantial discount to more typical book value multiples these companies have carried during healthy offshore drilling environments:

  • [By Max Byerly]

    Shares of Rowan Companies PLC (NYSE:RDC) rose 0.8% during mid-day trading on Thursday . The company traded as high as $16.36 and last traded at $16.09. Approximately 144,835 shares changed hands during mid-day trading, a decline of 94% from the average daily volume of 2,492,971 shares. The stock had previously closed at $16.22.

  • [By Ethan Ryder]

    Rowan Companies (NYSE:RDC) has been given a $20.00 price objective by stock analysts at B. Riley in a report issued on Monday. The brokerage presently has a “buy” rating on the oil and gas company’s stock. B. Riley’s target price would suggest a potential upside of 54.32% from the stock’s previous close.

  • [By Shane Hupp]

    California Public Employees Retirement System reduced its position in Rowan Companies PLC (NYSE:RDC) by 5.9% during the first quarter, according to its most recent filing with the Securities and Exchange Commission (SEC). The firm owned 656,438 shares of the oil and gas company’s stock after selling 41,386 shares during the quarter. California Public Employees Retirement System owned 0.52% of Rowan Companies worth $7,575,000 as of its most recent SEC filing.

Saturday, March 16, 2019

Top Stocks To Invest In 2019

tags:OPK,KE,CLF,

Chipotle Mexican Grill Inc. (NYSE: CMG) shares sank on Thursday after the burrito chain announced that it would be instigating a few changes to drive the brand forward. Apart from a marketing blitz and loyalty program, Chipotle will be closing some underperforming stores as well.

As part of its restructuring, Chipotle is shuttering 65 restaurants. The chain also will be adding “in-app” delivery of its products to about 2,000 restaurants by the end of the year.

The burrito chain said it would launch a customer loyalty program in 2019 and is exploring offering $2 tacos with a drink as part of a proposed “happy hour.”

The restructuring to execute on the strategy will require changes to the organization and to the culture, which will result in non-recurring charges during the second quarter and over the next several quarters. These non-recurring costs primarily relate to the moving of offices, the restructuring of the organization and closing underperforming restaurants. In aggregate, Chipotle expects these costs, together with a small amount of other unusual items, to be in the range of $115 million to $135 million.

Top Stocks To Invest In 2019: Opko Health Inc(OPK)

Advisors' Opinion:
  • [By Todd Campbell]

    After the U.S. Securities and Exchange Commission (SEC) levied charges against Opko Health (NASDAQ:OPK) and billionaire CEO Phillip Frost last week, bargain hunters bid the company's share price up 15% on Monday.

  • [By Keith Speights]

    Shares of Opko Health, Inc. (NASDAQ:OPK) were down 18% as of 3:34 p.m. EDT on Friday after the Securities and Exchange Commission (SEC) charged 10 individuals, along with 10 entities associated with these individuals, with fraud. Both Opko Health and its CEO, Phillip Frost, were named in the charges. Trading of the stock was also halted. 

  • [By George Budwell]

    Shares of the diversified healthcare company Opko Health, Inc. (NASDAQ:OPK) gained a healthy 27.6% last month, according to S&P Global Market Intelligence. What sparked this double-digit rally?

  • [By Logan Wallace]

    OPKO Health (NASDAQ:OPK) shot up 2.3% on Monday . The stock traded as high as $4.31 and last traded at $4.17. 127,421 shares traded hands during trading, a decline of 98% from the average session volume of 5,550,241 shares. The stock had previously closed at $4.27.

  • [By VantagePoint]

    OPKO Health, Inc. (NASDAQ: OPK) follows a similar pattern, but to the downside. The market had a crossover to the upside in mid-April when that blue line made the cross above the black line. All of this indicated to traders that an uptrend was beginning. But over the last three trading days the stock appears to have entered a downtrend, as the two lines have crossed back over. This will be one to watch for further potential downside activity.

  • [By Paul Ausick]

    Opko Health Inc. (NASDAQ: OPK) dropped nearly 7% Wednesday to post a new 52-week low of $4.28 after closing at $4.60 on Tuesday. The stock’s 52-week high is $9.01. Volume was around 7.7 million, nearly double the daily average of around 4.3 million. The company had no specific news.

Top Stocks To Invest In 2019: Kimball Electronics, Inc.(KE)

Advisors' Opinion:
  • [By Logan Wallace]

    First Trust Advisors LP lifted its position in Kimball Electronics Inc (NASDAQ:KE) by 18.0% in the 2nd quarter, according to the company in its most recent 13F filing with the Securities and Exchange Commission (SEC). The firm owned 30,252 shares of the electronics maker’s stock after purchasing an additional 4,611 shares during the period. First Trust Advisors LP owned about 0.11% of Kimball Electronics worth $554,000 as of its most recent filing with the Securities and Exchange Commission (SEC).

  • [By Stephan Byrd]

    BidaskClub lowered shares of Kimball Electronics (NASDAQ:KE) from a hold rating to a sell rating in a research note released on Thursday.

    Separately, TheStreet lowered Kimball Electronics from a b rating to a c+ rating in a research note on Wednesday, November 7th.

Top Stocks To Invest In 2019: Cliffs Natural Resources Inc.(CLF)

Advisors' Opinion:
  • [By Tyler Crowe, Sean Williams, and Brian Stoffel]

    So we asked three Motley Fool contributors to each highlight a stock they see as a great value investment today. Here's why they picked Walmart (NYSE:WMT), Bank of America (NYSE:BAC), and Cleveland-Cliffs (NYSE:CLF). 

  • [By Garrett Baldwin]

    Earnings season is well underway. And if you're looking to make real money, the time to get started is now. Money Morning Quantitative Specialist Chris Johnson argues the markets are at a tipping point. And with just a few smart plays in today's classic stock picker's market… you can pull in triple-digit gains with just a small investment. Read those picks right here.

    The Top Stock Market Stories for Friday General Electric Co. (NYSE: GE) leads the earnings calendar as reporting for the second quarter moves into full swing. The Boston-based conglomerate is expected to report earnings per share (EPS) of $0.18 on top of $29.76 billion in revenue. Former Dallas Federal Reserve Bank Vice President Jerry O'Driscoll offered some choice words for the U.S. central bank. In an interview with CNBC, O'Driscoll warned that the Fed is being "very aggressive" with interest rate policy in 2018. He warned the central bank is ignoring important factors like a rising dollar and the flattening yield curve. The former bank executive argued that he doesn't see the case for additional rate hikes in the year ahead. This is one reason why investors should protect themselves from any downside caused by the Fed. According to The Wall Street Journal, three top cybersecurity officials are departing their positions at the FBI. The departures are planned due to their ongoing concerns about cybersecurity attacks from abroad and disagreements with the Trump administration. Three Stocks to Watch Today: MSFT, SKX, SNA Shares of Microsoft Corp. (Nasdaq: MSFT) popped more than 3.2% after the cloud computing and software giant topped earnings expectations after the bell Thursday. The company topped $100 billion for its fiscal 2018. This is the first time that it has ever reached this revenue level for a year. The firm reported EPS of $1.13, topping Wall Street estimates by $0.05. The firm reported revenue of $30.09 billion, besting expectations of $29.21 billion. Shares of Snap-on
  • [By Tyler Crowe]

    Two stocks that look as though they are still being judged based on their former selves despite being fundamentally different are iron ore producer Cleveland Cliffs (NYSE:CLF) and renewable-power yieldco TerraForm Power (NASDAQ:TERP). Here's why investors might be scared off by their respective histories but why you should ignore the past and take a look at these stocks today. 

Thursday, March 14, 2019

Why Snap Stock Jumped Today

What happened

Shares of Snap (NYSE:SNAP) have jumped today, up by 11% as of 11:30 a.m. EDT, after the company received an upgrade from BTIG Research. Analyst Rich Greenfield has been a vocal skeptic of the Snapchat parent's turnaround prospects but is now changing his tune.

So what

BTIG had previously cut its rating on Snap to sell back in September, and then moved to the sidelines with a neutral rating in December. Greenfield is now boosting his rating to a buy with a $15 price target, despite noting that "virtually everything that could go wrong for Snapchat over the past couple years since going public has gone wrong." However, the analyst is encouraged that there has been a noticeable uptick in spending in North America by advertisers based in emerging markets, potentially taking advantage of low ad prices.

Examples of the group calling feature on Snapchat

Image source: Snap.

There has also been a noticeable improvement in the quality of ads in Snapchat's Discover section, with a "meaningful reduction in clickbait/seedy influencer content and an increase in premium/publisher content," according to Greenfield. Snapchat remains incredibly popular with core users who use the platform for communications, and Snapchat still has potential to expand internationally. The company's progress in improving the app's performance on Android is also a welcome sign.

Now what

BTIG still has some reservations, most notably the investigations by the U.S. Department of Justice and the SEC over IPO disclosures. The outcome of those investigations could hurt Snap's cash position.

Greenfield has adjusted his estimates, and now expects negative free cash flow of just $510 million. He no longer believes that Snap will need to raise capital in 2020. The analyst is now modeling for 2019 revenue of $1.65 billion, up from a prior estimate of $1.4 billion. Looking farther out, Greenfield expects 2022 revenue to be $3.4 billion, up from a prior estimate of $2.1 billion.

Tuesday, March 12, 2019

Why Shares of Avon Products, Inc. Gained 32.1% in February

What happened

Avon Products (NYSE:AVP) stock gained 32.1%% in February, according to data from S&P Global Market Intelligence . The stock posted gains early in the month and then continued to climb following the company's fourth-quarter earnings release on Feb. 14.

AVP Chart

AVP data by YCharts

February's big gains followed up the 54% jump that the stock saw in January pushed Avon stock to a fresh 52-week high. The company has languished in recent years amid mounting costs and declining revenue, but a restructuring initiative to get the business back to regular profitability has investors seeing bright spots in its earnings results and has sent shares soaring in 2019. 

A woman applying lipstick in a handheld mirror.

Image source: Getty Images.

So what

The company posted an adjusted loss per earnings of $0.08, down 33% year over year, on sales of $1.32 billion, up 2% overall but down 1.4% organically, in its December quarter. Sales and earnings performance for the period fell short of the average analyst targets, and Avon's stock actually fell shortly after the earnings release, but it bounced back to post gains not long after.

February saw the company complete the sale of its Chinese manufacturing operation -- a step in reducing its international business and reducing its employee count. The company also published a press release on Feb. 25 outlining the launch of a content studio to support the growth of its digital business.

Now what

Avon's fourth-quarter performance didn't have much to cheer about by usual standards, but slowing revenue declines and aggressive cost-savings initiatives present a feasible path to improved earnings performance. It's possible that additional developments and confidence in the company's turnaround effort will continue to spur rapid stock growth, but investors may want to approach with caution with shares trading at roughly 25 times this year's expected earnings and big questions remaining about how the business can re-energize sales.

support.com Inc (SPRT) Files 10-K for the Fiscal Year Ended on December 31, 2018

support.com Inc (NASDAQ:SPRT) files its latest 10-K with SEC for the fiscal year ended on December 31, 2018. support.com Inc is a provider of cloud-based software and services for technology support. Its solutions include a SaaS-based Nexus Service Platform, mobile and desktop apps, and a scalable workforce of technology specialists. support.com Inc has a market cap of $43.500 million; its shares were traded at around $2.30 with and P/S ratio of 0.62.

For the last quarter support.com Inc reported a revenue of $18.0 million, compared with the revenue of $15.03 million during the same period a year ago. For the latest fiscal year the company reported a revenue of $69.5 million, an increase of 15.7% from last year. For the last five years support.com Inc had an average revenue decline of 6.6% a year.

The reported loss per diluted share was 48 cents for the year, compared with the loss per share of $1.49 in the previous year. The support.com Inc had an operating margin of -0.09%, compared with the operating margin of -2.39% a year before. The 10-year historical median operating margin of support.com Inc is -21.61%. The profitability rank of the company is 2 (out of 10).

At the end of the fiscal year, support.com Inc has the cash and cash equivalents of $49.6 million, compared with $18.1 million in the previous year. The company had no long term debt. The interest coverage to the debt is 2.2, which is not a favorable level. support.com Inc has a financial strength rank of 8 (out of 10).

At the current stock price of $2.30, support.com Inc is traded at 68.9% discount to its historical median P/S valuation band of $7.39. The P/S ratio of the stock is 0.62, while the historical median P/S ratio is 2.04. The stock lost 7.6% during the past 12 months.

For the complete 20-year historical financial data of SPRT, click here.

Saturday, March 9, 2019

Ask a Fool: Should I Buy Marijuana Stocks?

Q: I've seen tons of hype about marijuana stocks. Should I put some of my money into the space, or is it a bad choice?

The marijuana industry is a young and high-potential space, so there's definitely lots of room for long-term growth.

However, it's important to approach this with the right mentality. Investing in any up-and-coming industry is a speculative practice. That is, it's highly risky and you shouldn't invest any money that you aren't prepared to lose -- even if you think a particular company looks like a potential gold mine.

I don't want to discuss any individual companies, but it would be smart to approach investing in marijuana stocks in a similar manner as tech stocks in the late 1990s. Some will probably do wonderfully. People who invested in Amazon.com or Priceline (now Booking Holdings) during the dot-com boom and held on to their shares have made fortunes. People who invested in companies like Pets.com -- not so much.

With that in mind, I'd advise you to do two things if you want to add some marijuana stocks to your portfolio.

First, only use a small portion of your investable assets. If you put, say, 5% of your portfolio in marijuana stocks, that's all you can lose if things go badly. And if one of them turns out to be the Amazon of the marijuana industry, it'll still be enough to produce a significant win.

Second, don't put all of your eggs in one basket. Whatever money you decide to invest in the marijuana industry, spread it among at least three or four reputable companies -- not penny stocks.

If you do those two things, you'll set yourself up to profit if you're right, but at the same time, you won't be devastated if things go badly.

Friday, March 8, 2019

$707.80 Million in Sales Expected for Hill-Rom Holdings, Inc. (HRC) This Quarter

Equities analysts expect that Hill-Rom Holdings, Inc. (NYSE:HRC) will announce sales of $707.80 million for the current quarter, Zacks Investment Research reports. Four analysts have provided estimates for Hill-Rom’s earnings. The lowest sales estimate is $702.60 million and the highest is $716.20 million. Hill-Rom posted sales of $710.50 million during the same quarter last year, which would indicate a negative year-over-year growth rate of 0.4%. The firm is expected to issue its next quarterly earnings results on Friday, April 26th.

According to Zacks, analysts expect that Hill-Rom will report full year sales of $2.88 billion for the current fiscal year, with estimates ranging from $2.87 billion to $2.89 billion. For the next fiscal year, analysts anticipate that the company will report sales of $2.97 billion, with estimates ranging from $2.95 billion to $3.00 billion. Zacks Investment Research’s sales averages are a mean average based on a survey of sell-side research firms that that provide coverage for Hill-Rom.

Get Hill-Rom alerts:

Hill-Rom (NYSE:HRC) last released its earnings results on Friday, January 25th. The medical technology company reported $1.02 EPS for the quarter, beating the Thomson Reuters’ consensus estimate of $0.98 by $0.04. Hill-Rom had a return on equity of 21.23% and a net margin of 7.21%. The company had revenue of $683.50 million during the quarter, compared to analysts’ expectations of $676.39 million. During the same period in the prior year, the business posted $0.92 EPS. The business’s revenue was up 2.1% on a year-over-year basis.

HRC has been the topic of several research analyst reports. ValuEngine upgraded Hill-Rom from a “hold” rating to a “buy” rating in a research note on Saturday, January 19th. Morgan Stanley reduced their price objective on Hill-Rom from $100.00 to $98.00 and set an “equal weight” rating on the stock in a research note on Wednesday, January 2nd. UBS Group initiated coverage on Hill-Rom in a research note on Tuesday, November 27th. They set a “buy” rating and a $115.00 price objective on the stock. Finally, Zacks Investment Research cut Hill-Rom from a “buy” rating to a “hold” rating in a research note on Wednesday, November 14th. One analyst has rated the stock with a sell rating, three have given a hold rating and six have given a buy rating to the stock. The stock presently has a consensus rating of “Buy” and an average target price of $102.67.

Shares of HRC opened at $103.73 on Thursday. Hill-Rom has a 12-month low of $81.82 and a 12-month high of $108.10. The firm has a market cap of $6.97 billion, a P/E ratio of 21.84, a PEG ratio of 1.48 and a beta of 0.95. The company has a current ratio of 1.70, a quick ratio of 1.25 and a debt-to-equity ratio of 1.17.

Hedge funds and other institutional investors have recently modified their holdings of the business. Oregon Public Employees Retirement Fund increased its position in Hill-Rom by 8,755.0% in the fourth quarter. Oregon Public Employees Retirement Fund now owns 2,308,056 shares of the medical technology company’s stock worth $26,000 after buying an additional 2,281,991 shares during the period. Financial Gravity Companies Inc. acquired a new stake in Hill-Rom in the fourth quarter worth $48,000. Captrust Financial Advisors increased its position in Hill-Rom by 166.3% in the fourth quarter. Captrust Financial Advisors now owns 783 shares of the medical technology company’s stock worth $69,000 after buying an additional 489 shares during the period. IMS Capital Management acquired a new stake in Hill-Rom in the third quarter worth $71,000. Finally, Bronfman E.L. Rothschild L.P. increased its position in Hill-Rom by 47.7% in the fourth quarter. Bronfman E.L. Rothschild L.P. now owns 907 shares of the medical technology company’s stock worth $80,000 after buying an additional 293 shares during the period. 82.41% of the stock is currently owned by hedge funds and other institutional investors.

About Hill-Rom

Hill-Rom Holdings, Inc operates as a medical technology company worldwide. It operates in three segments: Patient Support Systems, Front Line Care, and Surgical Solutions. The company offers medical surgical beds, intensive care unit beds, and bariatric patient beds, lifts and other patient mobility devices, non-invasive therapeutic products and surfaces, and information technologies and software solutions; and medical equipment management services, as well as sells equipment service contracts for its capital equipment.

Featured Article: Market Capitalization, Large-Caps, Mid-Caps, Small-Caps

Get a free copy of the Zacks research report on Hill-Rom (HRC)

For more information about research offerings from Zacks Investment Research, visit Zacks.com

Earnings History and Estimates for Hill-Rom (NYSE:HRC)

Thursday, March 7, 2019

Constellation Brands Stock Looks Even More Compelling Now

There has been a lot of talk about Canadian cannabis companies over the past several months. Most of that talk has been positive, and a lot of it has centered around Canadian cannabis leader Canopy Growth (NYSE:CGC). Consequently, over the past year, CGC stock has rallied more than 75%.

STZ Stock Looks Even More Compelling NowSTZ Stock Looks Even More Compelling NowSource: Shutterstock

But, no one ever seems to talk about the company behind Canopy — Constellation Brands (NYSE:STZ). To kick-start the entire cannabis craze, Constellation Brands poured $4 billion into Canopy in 2018 to gain ample exposure to the cannabis industry. Despite that big investment, while CGC stock is up 75% over the past year, STZ stock is down 25%.

That’s 100 points of divergent performance. That doesn’t make sense, considering Constellation owns more than 30% of outstanding common CGC shares. It also doesn’t make sense considering that the global alcohol industry will keep growing over the next several years, even as the cannabis market goes global.

As such, CGC looks compelling on this dip. I’m a buyer here and lower, all else equal.

The Alcohol Industry Is Stable

The big reason behind the recent selloff in STZ stock has to do with cannabis. Namely, the consensus thesis out there is that as the recreational cannabis market becomes increasingly legal, convenient and large, it will take share from the alcoholic beverage market. As that happens, STZ’s sales will drop, margins will come under pressure, and profit growth will fall flat. That’s why STZ stock has dropped 25% over the past month, as the cannabis craze has picked up steam.

But, that thesis is flawed.

To be sure, there is an overlap between the pot smoking and beer drinking crowds. And, as weed becomes more easily accessible and legal, there will be a handful of consumers who choose to smoke weed rather than drink beer. But, data suggests that this is a small portion of the market, and that most adult users will both drink beer and smoke pot.

According to detailed data from the National Survey on Drug Use and Health (NSDUH), marijuana usage rates among U.S. adults age 18 or older have climbed from 6% in 2002 to nearly 10% in 2017. During that same stretch, cigarette smoking usage rates among the same cohort have dropped from 27.5% to below 20%. Meanwhile, alcohol consumption rates have actually increased from 54.9% to 55.9%.

There are many things at play here, but the broad takeaway is clear. As marijuana consumption has risen, it has taken share from the tobacco industry, not the alcoholic beverage industry. Instead, alcohol consumption rates have actually slightly risen over the past two decades as marijuana usage has become more prevalent. From this perspective, it shouldn’t be surprising that alcoholic beverage sales are not down in U.S. states that have legalized cannabis.

If you extrapolate this out, it’s easy to see that fears related to a big slowdown at STZ as a result of widespread cannabis legalization and usage are overblown. Constellation’s alcohol sales will be just fine over the next several years. Meanwhile, the company will win big thanks to its 30%-plus ownership stake in Canopy as the cannabis market grows by leaps and bounds. Altogether, then, Constellation actually has healthy growth prospects over the next several years.


Compare Brokers
Valuation Is Anemic

The opportunity in STZ stock is that healthy growth is far from priced in today. Thus, as healthy growth materializes over the next several years, it will converge on a discounted valuation, and result in a pop in STZ stock.

At the current moment, STZ stock trades nearly 30% off all-time highs. It’s also well below all of its major moving averages, and trades at just 17X forward earnings, versus a five-year average forward multiple of nearly 23. All other major valuation multiples are also currently at a discount to their five-year averages.

In other words, what you have with STZ is a really beaten up and lowly valued stock with depressed investor sentiment. That is the sort of set up that lends itself to a big rally in the event that fundamentals improve, which they will over the next several quarters and years.

Bottom Line on STZ Stock

Constellation Brands has been unfairly beaten up on irrational concerns that the alcoholic beverage market will be eaten alive by the cannabis market. These irrational concerns won’t last forever, so investors should take advantage of this near-term disconnect between price and reality.

As of this writing, Luke Lango was

Wednesday, March 6, 2019

Interxion Holding N.V (INXN) Q4 2018 Earnings Conference Call Transcript

Logo of jester cap with thought bubble.

Image source: The Motley Fool.

Interxion Holding N.V  (NYSE:INXN)Q4 2018 Earnings Conference CallMarch 06, 2019, 8:30 a.m. ET

Contents: Prepared Remarks Questions and Answers Call Participants Prepared Remarks:

Operator

Ladies and gentlemen, thank you for standing by, and welcome to the Q4 2018 Earnings Webcast. At this time, all audio participants are in a listen-only mode. During the presentation, we will have a question-and-answer session. (Operator Instructions). I must advise the webcast is being recorded today, Wednesday, the 6th of March 2019.

I'm going to pass the webcast over to your first speaker today, Jim Huseby. Please go ahead.

Jim Huseby -- Investor Relations

Thank you, Callum. Hello everybody, and welcome to InterXion's fourth quarter and year-end 2018 earnings conference call. Today, I'm joined by David Ruberg, InterXion's Vice Chairman and CEO; John Doherty, the Company's Chief Financial Officer; and Giuliano Di Vitantonio, our Chief Marketing and Strategy Officer. To accompany our prepared remarks, we prepared a slide deck, which is available on the Investor Relations page of our website at investors.interxion.com.

Before we get started, I'd like to remind everyone that some of the statements that we will be making today are forward-looking in nature and involves risks and uncertainties. Actual results may vary significantly from those statements and may be affected by the risks we identified in today's press release and those identified in our filings with the SEC. We make no obligation, and do not intend to update or comment on forward-looking statements made on this call.

In addition, we will provide non-IFRS measures on today's conference call. We provide a reconciliation of those measures to the most directly comparable IFRS measures in today's press release, which is posted on our Investor Relations page at investors.interxion.com. We'd also like to remind you that we post important information about InterXion on our website at interxion.com, and on social media sites such as LinkedIn and Twitter.

Following our prepared remarks, we will be taking questions. And now I'm pleased to hand the call over to InterXion's CEO, David Ruberg. David?

David Ruberg -- Chief Executive Officer

Thank you, Jim, and welcome to our fourth quarter and year-end 2018 earnings call. During the fourth quarter, InterXion again delivered solid growth, reflecting a combination of favorable European demand trends, consistent execution, and a sustained high level of data center expansion across our footprint to meet the requirements of our customers.

The cloud and content platforms remain active, in terms of expanding their colocation capacity for core and edge notes, not only the Big 4 markets, but increasingly in other key European markets as well. These customers understand InterXion's value proposition and are seeking to leverage the dense connectivity available in our data center campuses.

All of this is taking place against the backdrop of global digital transformation. The real value comes not just from the conversion to digital, but particularly the move to connected digital. The way in which we live, work and communicate with our families, friends and business contacts is fundamentally changing. How we produce and consume content, manufacture products, take care of our health or drive somewhere are evolving at a dramatic pace. This is all happening in real time. The combination of our highly connected data centers, our breadth of coverage and our strategic approach, which is focused on the longer-term, means that we remain extremely well positioned to capture the demand for colocation capacity now and over the coming years.

Please turn the Slide 4. Turning to the highlights of our full year 2018 results. InterXion posted 15% year-over-year growth in both recurring and total revenue, while adjusted EBITDA increased by 17%, representing year-over-year EBITDA margin expansion of 70 basis points to 45.9%. We invested over EUR450 million of capital expenditure in the business.

During the year, we opened two new data centers and expanded capacity in 9 of our 11 countries, with the remaining two countries scheduled to open new capacity in the first half of 2019. Against the backdrop of high demand-driven expansion, we maintained a steady utilization rate of 79%, reflecting our discipline in matching new capacity to the demand that we're experiencing and we continue to grow our land bank for future expansion with land acquired in four markets during the year.

Please turn to Slide 5. Now turning to the highlights of our fourth quarter results. InterXion posted 13% year-over-year growth in both recurring and total revenue in Q4. Adjusted EBITDA increased by 15%, representing year-over-year margin expansion of 60 basis points. We invested over EUR130 million in capital expenditure, opening data center expansions in three countries. Two new data center builds were announced in the quarter, which are in Frankfurt and Marseille. Bookings of quarter remained strong, while the sales pipeline continues to reflect solid demand, and pricing remains stable and churn continues to be low and within our historical ranges.

Please turn to Slide 6. Looking at the Q4 financials in a little more detail. Revenue in Q4 came in at EUR147 million, up 13% from last year and up 3% sequentially. Recurring revenue at nearly EUR140 million, represented 95% of total revenue, was also up 13% compared to last year. And adjusted EBITDA was just below EUR68 million, an increase of 15% year-over-year and 3% sequentially, equating to an adjusted EBITDA margin of 46.1%. And John will talk in more detail about these numbers later in the call.

Please turn to Slide 7. We added 4,500 square meters of equipped space in the fourth quarter, bringing the total increase for the year to 22,300 square meters. We ended 2018 with 144,800 square meters of equipped space. We had a 3,800 square meters of revenue generating space in the quarter, with significant installations in Germany, Frankfurt and the Netherlands. For the full year 2018, the increase was 15,200 revenue generating square meters, keeping pace with a quick capacity such that utilization at the end of the year remain fairly steady at 79%.

Recurring cross connect revenue continue to grow faster than recurring revenue on a year-over-year basis and contributed 6% of total revenue in the fourth quarter. We had noticed the customers have started the transition from 10 gig cross connects to 100 gig cross connects, which we expect will unfold over a number of years as new technologies are rolled out to carry data traffic that is expected to grow almost five-fold over the next five years.

Please turn to Slide 8. During the fourth quarter, new capacity was opened in three of our four Big 4 markets, specifically Amsterdam, Paris and Frankfurt, followed by the opening of our third data center in London, early in the first quarter. Since the end of the third quarter, we've also announced three new data center builds, which are Marseille 3, Frankfurt 15 and today Zurich 2. Additionally, we are announcing that we're equipping a further 2,600 square meters in Frankfurt 15.

Including this expansion, we've announced additions to our equipped space capacity of over 28% through to the end of 2020. Of this new capacity, over 70% is scheduled to open between mid-2019 and the end of next year. We have newbuilds under way at 9 out of the 11 countries in which we operate. We also added to our land bank in Copenhagen and Zurich in the fourth quarter.

Please turn to Slide 9. In Q4, we continue to see the same bookings and revenue trends that we saw in previous quarters. While all segments are growing, the growth from platforms is faster than the growth from enterprise and connectivity. As a result, we now have 38% of our revenue coming from platforms and the remaining 62% almost equally split between connectivity and enterprise. We expect this trend to persist in the coming quarters as the strong backlog and bookings from platforms converts into revenue. With more platforms joining our connected communities and expanding across multiple locations, we are seeing a more widespread distribution of revenue across this segment, with five cloud providers and two content providers in our top 20 customers by revenue. The remainder of the list includes nine connectivity providers and four enterprises.

The value that we get from the platforms goes beyond the top line contribution fueled by compute nodes. These customers continue to deploy network nodes that add tremendous value to our connected community and they're doing across new countries and new locations. For instance, Google recently added a Google Cloud Interconnection PoP in Zurich, a location where the demand for cloud is growing rapidly. This follows similar deployments by them in Stockholm, Madrid and Marseille over the last two quarters. These deployments demonstrate the demand for private connections to access public clouds in a secure and reliable manner. It is steadily growing across Europe. Since August of 2018, we have seen 10 new on-ramps installed in our data centers by major cloud providers.

In the connectivity sector, Q4 was a particularly strong quarter capping a year of solid growth across all of our cities, but especially Marseille, Frankfurt and Madrid. While connectivity is the most mature segment, high growth in the volume of traffic generated by cloud and content providers is a catalyst for connectivity providers to expand capacity in our facilities and to deploy increased numbers of cross connects.

In the enterprise segment, we're in the early innings of a market transition which is starting to attract a new breed of customers to colocations. These are enterprises that in the past would have typically run their IT in their own data center or in an outsourced environment. They are now in the early stages of the digital transformations and require more connected and hybrid IT architecture. These customers typically start with a small deployment and private multi-cloud connections, and then expand as their requirements grow. Overtime, we will see larger deployments for enterprises engaging in more fundamental rearchitected their IT infrastructure.

European enterprises such as Carlsberg, one of leading brewery groups in the world are examples of customers and companies at the forefront of a wave of digital transformation. These companies have chosen to deploy significant elements of their IT infrastructure at InterXion. They appreciate the significant value at a colocation environment offers to a digital enterprise architecture. The benefits include low latency access to multiple clouds and superior edge network performance to enhance their customers experience, while retaining security and flexibility. This transportation -- this transformation opportunity is just emerging as expected to gain momentum in the coming years.

With that, I would now like to turn the call over to John.

John Doherty -- Chief Financial Officer

Thanks, David. It's a pleasure to participate on the call today. I've enjoyed the opportunity to reconnect and meet with many of our investors and analysts since I joined InterXion in November. After four months at the Company, I'm more excited than ever about the opportunities ahead of us.

Please turn to Slide 11. As David highlighted, InterXion delivered another solid quarter and total revenue growth of 13% compared to the prior year and 3% higher sequentially. Currency movements were not significant in the quarter. As a result, constant currency growth rates, both year-over-year and sequentially were consistent with reported growth rates. Recurring revenue in the fourth quarter was EUR139.7 million, also representing a 13% year-over-year increase and a 4% sequential increase.

Recurring ARPU was EUR412 per month in the quarter, consistent with our expectations and down EUR1 from third quarter due to the dilutive impact of new installations largely occurring late in the quarter. Notably, ARPU increased slightly year-over-year, despite a large volume of new customer installations during the year. Recurring revenue remained at 95% of total revenue in the quarter. Non-recurring revenue in Q4 was EUR7.2 million, up 12% year-over-year and down 3% sequentially.

Cost of sales was EUR57.2 million in the quarter, up 17% year-over-year and up 2% sequentially, resulting in gross profit of EUR89.7 million, and a 11% increase year-over-year and 4% sequentially. The gross profit margin for the quarter was 61.1%, down from 62.4% a year ago. As we discussed last year, the Q4 2017 results included a number of one-time items that positively impacted our gross profit margin. The largest was a usage space energy credit in Germany, for which the full annual impact was recognized in the Q4 '17 numbers. Normalized for these one-time items, the year-over-year reduction in our gross profit margin was a more modest 40 basis points, primarily due to the expansion drag associated with bringing on new capacity.

Sales and marketing expenses were EUR9.5 million in the fourth quarter, up 5% year-over-year and up 9% from the third quarter, with a sequential increase reflecting seasonality of marketing activity. Fourth quarter sales and marketing costs were 6.4% of total revenue, consistent with the 6% to 7% range that we have seen throughout 2018. Other G&A costs were EUR12.5 million in the quarter, down 3% year-over-year and up 6% sequentially. At 8.5% of revenue, other G&A costs remained within our expected range of 8% to 9% of revenue.

Adjusted EBITDA at EUR67.7 million increased 15% year-over-year and was up 3% sequentially, resulting in an adjusted EBITDA margin of 46.1%. This represented a year-over-year increase of 60 basis points and a 20 basis point sequential reduction.

Fouth quarter depreciation and amortization expense came in at EUR34.3 million, an 8% -- excuse me, an 18% increase year-over-year and up 4% sequentially, and continues to be consistent with our growing depreciable asset base. The finance expense in the fourth quarter was EUR15.8 million, 28% higher than in Q4 '17 and 34% higher than the prior quarter. This increase was primarily a function of higher principal amounts following the 2018 refinancing and bond tap.

Income taxes in the fourth quarter were EUR7.3 million, an increase of EUR2.8 million from Q3, equating to an effective tax rate of 48%. This increase is largely due to the impact of reductions in local corporate tax rates on our deferred tax positions, particularly in the Netherlands. Excluding this and other non-deductible expenses such as share-based payments, the normal effective tax rate is 26%.

Our LTM cash tax rate at 34.6% continues to reflect the impact of the Q2 refinancing. Net income was EUR8 million in Q4, down 18% year-over-year and 20% sequentially, due to the higher finance and tax expenses. These factors also impacted adjusted net income in the quarter, which came in at EUR7.8 million, down 26% year-over-year and down 33% sequentially. EPS and adjusted earnings per share were each at EUR0.11 on a diluted share count of 72.2 million shares.

Please turn to Slide 12. Strength in InterXion's Big 4 markets continued in the fourth quarter, led once again by Germany and France. Revenue was EUR97.3 million, up 14% year-over-year and 4% sequentially on both reported and constant currency basis. Adjusted EBITDA in the Big 4 was EUR52.6 million in the quarter, a year-over-year increase of 9% and a sequential increase of 1%, with continued strong margins of 54%.

Our Rest of Europe segment also delivered double-digit growth, with fourth quarter revenue of EUR49.6 million, up 12% year-over-year and up 2% sequentially on both reported and constant currency basis, led by Austria, Denmark and Sweden. Adjusted EBITDA in the Rest of Europe segment was EUR30.2 million, up 16% year-over-year and 5% sequentially, with an adjusted EBITDA margin of 60.9%, an increase of 190 basis points from the third quarter.

Please turn to Slide 13. Turning briefly to a review of the full year 2018 results. Total revenue was EUR561.8 million, up 15% year-on-year. Foreign exchange had no material impact on our full year results. Recurring revenue was EUR533.1 million, up 15% over 2017. Cost of sales was EUR219.5 million, up 15% year-over-year. Gross profit was EUR342.3 million, also up 15%, while gross margins were a modest 20 basis point decline to 60.9%. Sales and marketing costs were EUR36.5 million, up 9% year-over-year, while other G&A costs were EUR48 million, up 8% versus 2017. This resulted in solid operating leverage at the adjusted EBITDA line with growth of 17% and margins expanded by 70 basis points despite the slight decline in gross profit margin.

Looking ahead into 2019, we expect ARPU to remain within a range of EUR411 and EUR415, based on the timing of new customer installations, as continued growth in the base is offset by the dilutive impact of new installations. Cross connect revenue is expected to be approximately 6% of total revenue for the year. Non-recurring revenue should remain at approximately 5% of total revenue. Sales and marketing costs are expected to remain within the 6% to 7% range that occurred in 2018, while other G&A costs are likely to rise toward 10% of revenue in the first quarter due to normal seasonality before settling down at near 9% of total revenue for the remainder of 2019. In light of growing energy costs and continued expansion drag from new capacity openings, adjusted EBITDA margin is expected to remain steady in 2019.

Please turn to Slide 14. From the beginning of 2019, we have adopted IFRS 16. I will not spend much time on this during the call as most of you will be familiar with the primary impacts of this new lease accounting standard given its similarity to changes happening in US GAAP. In practical terms, IFRS 16 means that operating leases will be brought on to the balance sheet and treated in the same way as we treat finance leases. The end result is a reduction in rent expense and an increase in interest expense and depreciation charges from the capitalized lease (ph), but there is no cash impact.

Compared with 2018, IFRS 16 is expected to have the following impact on our key financial metrics as set out on the slide. Total revenue and recurring revenue will see a negligible impact from IFRS 16. Adjusted EBITDA margin in 2018 would have benefited by approximately 600 basis points, and gross leverage adjusted for full year 2018 on the same basis will increase slightly under one turn as future lease payments will be recognized as liabilities. This adjustment is not expected to have any impact on our credit ratings, and IFRS 16 does not form part of our financial covenant reporting.

Throughout 2019, we will provide a quarterly reconciliation of key metrics between the reported results on an IFRS 16 basis and the previous basis. Overall, it should be noted that following the implementation of IFRS 16, our financial results, particularly in terms of adjusted EBITDA margin, will be reported in a way that is more consistent with our US peer group.

Please turn to Slide 15. InterXion remains in expansion mode in response to continued strong demand. During 2018, we invested EUR451 million in capital expenditure, 93% of which was allocated to capacity increases. Over the last three years, that is between 2016 and 2018, InterXion has invested approximately EUR960 million in CapEx and increased equipped capacity by approximately 44,000 square meters, an increase of 43%. During this time, our utilization rates have remained within a tight range close to 80%. A portion of our future CapEx will continue to be deployed on freehold and land acquisitions to meet future expansion requirements, alongside the ongoing cycles of investment in our existing data center portfolio. We remain consistent and highly disciplined with respect to our capital allocation processes and anticipated returns.

Please turn to Slide 16. InterXion ended the year with EUR186.1 million in cash and cash equivalents, with the refinancing and subsequent bond tap being the most significant balance sheet events for the year, giving us greater flexibility with the unsecured status of the notes. Our EUR200 million RCF was undrawn at the year end, giving us nearly EUR400 million in available liquidity. In this quarter, we increased our RCF by a further EUR100 million to provide additional flexibility.

Our credit metrics remain solid with net leverage at 4.3 times and all announced expansion projects through 2019 being fully funded. Cash ROGIC, which is our measure of return on gross invested capital was 10% in 2018 and consistent over the last two years.

Please turn to Slide 17. At the end of 2018, a group of 37 fully built-out data centers contain 91,800 square meters of equipped space. This group is 82% utilized and continue to generate strong and stable cash returns of 23% over the last 12 months with gross margin of 66%. The revenue and returns of a single data center will typically grow for a number of years after the site is essentially full from a space perspective. The combination of annual escalators, customers increasing their energy consumption and the growing contribution from cross connects are the drivers of the 5% LTM recurring revenue growth scene for this group of data centers.

As we have done in prior years, we will reset the basis for this chart on our first quarter earnings call, as you roll the period forward by a year to include all of our fully built-out data centers as of January 1st 2018.

And with that, I will now turn the call back over to David.

David Ruberg -- Chief Executive Officer

Thank you, John. As we wrap up another successful year for InterXion, I wanted to come back to the strategy that has brought us to where we are today and continues to be the guiding principle for current and future investments. For InterXion, it all starts with our relentless customer focus that has always been at the heart of our culture. By building trusted relationships with our customers, not only we've been able to sustain the growth of our Company, but it has helped us to anticipate future directions and make the appropriate investments to stay well positioned.

A year-ago, we introduced a new framework to understand, manage and serve our customer base, predicated on the realization that there are three games going on simultaneously in the industry. One game for the most mature segment, which is connectivity. Another game for the segment that is approaching the steepest portion of the adoption curve, namely platforms. And one game for the segment that has the largest long-term potential, which is enterprise. Each of these games started at a different point in time and is currently in a different inning. There are also sub games that are unfolding and powerful inter dependencies between these games that we explore during the 2018 earnings calls.

The rapid growth of cloud platform and content platforms creates opportunities for both connectivity and enterprise. That is the heart of the connected communities that we enable. This concept is virtually depicted on this slide, which describes directionally where the industry is headed without the intent to provide accurate predictions on relative size and timing of these opportunities. As we enter 2019, we can look at how these segments have evolved over the past year and how they are contributing to our business.

Connectivity remains the foundation for everything we do, as well as the key barrier to entry for competitors with the real estate orientation. Industry analyst agree that global data traffic is growing rapidly, especially in Europe, which is in turn driving demand for new PoPs from connectivity providers, as well as CDNs. Although these deployments were generally small, they tend to have higher ARPUs while driving adoption of cross connects and cloud connect. This all helps to create stickiness in our communities.

The connectivity segment still represents almost one-third of our revenue and we saw a healthy growth in 2018 on the back of the interplay of platforms and connectivity. With changing data traffic patterns, we have seen European carriers become more prominent in our data centers. This partly reflects the local origin of traffic pushed through the interconnection hubs by cloud and by content providers, which is in contrast to the past when global traffic between carriers was a more prominent feature.

We continue to expect a mid to high single-digit growth for the segment in coming years. We may see the occasional new player into the market, but growth will primarily stem from the covenants in spending into new geographies, deploying new services, adding cross connects and additional PoPs to adjust the explosion in the volume of data traffic.

Platforms, especially clouds dominated demand in 2018, representing over 60% of bookings, a trend that we expect to continue to see over the next two or three years. While we continue to see a high concentration demand within this segment, we are witnessing more evenly distributed demand across the top cloud providers. These market leaders are increasing the size of the deployments and the duration of the contracts, as our long-term demand becomes more predictable. All cloud providers have continued to deploy network nodes in highly connected locations. There is a growing awareness on their part of the value deploying compute capacity in close proximity to these network nodes. This is one of the key factors leading cloud providers to deploy compute nodes with interaction and locations that were originally developed purely as interconnection hubs. These locations have now becoming cloud in content hubs and are evolving into larger connected campuses.

As we develop deeper relationships with the large cloud customers, we increasingly focus on their key requirements which are: including line of sight to long-term capacities, flexibility of data center designs, Pan European coverage, consistent execution across countries, and flawless post sale operations.

Content platforms are driven by different set of requirements, as they're implementing a very distributed network architecture, with subsea cables and edge notes carrying large volumes of traffic. Some of these providers have decided to deploy the compute capacity in the public clouds, especially in the regions outside the US, which provides another driver to the emergence of connected communities in our data center. Both types of these platforms are approaching the steepest part of the S-curve, adoption curve in Europe as the global adoption of cloud and content services continues to unfold and new technologies as virtual reality and AI become mainstream. Our observation remains that different countries are at varying stages of maturity with European roll out typically starting in UK and cascading across Western Europe and into other regions.

Consequently, the platform segment overall has substantial headroom for growth, especially in the countries where cloud adoption is in its infancy. As we entered 2019, this segment represents almost 40% of our revenue, and we expect this proposition a proportion to grow in the next couple of years.

Demand from enterprises continue to evolve in 2018, as they are undergoing a radical transformation of IT architecture, shaped by digital transformation and the migration to the cloud, which leads to the diminishing role of enterprise owned data centers, and an evolution of enterprise network and IT outsourcing. As a result of this transition, the demand for traditional IT outsourcing is now shifting toward demand for co-location as a cloud enabler. We expect that the bulk of the demand will shift from non-carrier dense data centers to locations where the cloud provides -- cloud providers deploy their on-ramps and will take a couple of years for the crossover point to be reached.

From a geographical standpoint, the enterprise segment in Europe is not like in US by as much as it is for platforms, because we have a large number of local enterprises that are starting their cloud journey where they are headquartered. This gives us a competitive advantage, because enterprises tend to pick one vendor and also use local systems integrators. We expect demand from this segment to continue to grow steadily over the next couple of years. To capture this opportunity, we are enhancing our local go-to-market capability focused on Europe to complement our international sales organization that remains focused on global customers.

Each of these three segments, connectivity, platforms and enterprises require a different approach, because of their respective stage in maturity, technical requirements and scale and complexity of the opportunity. Our go-to market model based on customer segments enables us to achieve this goal and to strike a careful balance between strengthening the installed base, capturing the ways of rapid growth and seeding the next wave of demand. At the same time, we continue to actively develop new products and implement operational improvements that meet the evolving requirements of the three segments. This is a balancing act that we've been performing successfully for quite some time and we will continue to provide the -- and will continue to provide the foundation of our future profitable growth.

Please turn to Slide 20. Before getting to specifics of our guidance, I'd again like to remind you about our guidance philosophy. Our approach is to provide annual guidance for revenue, adjusted EBITDA and CapEx on our Q4 call, and then potentially update guidance if appropriate during the year. For 2019, our guidance includes the adoption of IFRS 16, which does has -- does have a material impact on adjusted EBITDA. Therefore, for 2019, we expect total revenue to be in the range of EUR632 million to EUR647 millino. We expect adjusted EBITDA to be in the range of EUR324 million to EUR334 million, and we expect the capital expenditures to be between EUR570 million and EUR600 million.

Before opening up the call to Q&A, I would like again to express my thanks to all of our employees across the Company for their continued commitment and customer focus. The continued success of this Company is a product of their hard work. I would also like to thank our shareholders and bondholders for their continued support.

Now, let me hand the call back to the operator to begin the question-and-answer session.

Questions and Answers:

Operator

Thank you. (Operator Instructions) Our first question today comes from the line of Robert Gutman from Guggenheim Partners. Your line is now open.

Robert Gutman -- Guggenheim Partners -- Analyst

Hi. Thanks for taking my question. Can you clarify for us, how we should think about the leverage ratio given the impact of the accounting changes to EBITDA and in light of the the quantity of the scale of CapEx spending and the commentary that you are fully funded for 2019?

John Doherty -- Chief Financial Officer

Sure, I'll take that one. Let me give you more of a comprehensive answer. So we ended the year at 4.3 times net leverage. This is among the lowest leverage across the industry. While we don't have a formal target, I would be comfortable with it going a bit higher and obviously it will throughout the year, but I'm comfortable given how the business has been performing, the size and credit quality of our biggest customers and the longer average term of our contracts.

One of the things that is key and we're very confident in is the overall performance of the business. We want to ensure that we stay focused on the opportunities in front of us, continue to grow the top line at a healthy level and drive as much of that through to adjusted EBITDA. If we do, ultimately cash generation will help us to manage to leverage as we move throughout the year. I expect on their current course and speed, we will drew it up to just north of five, but I'm relatively comfortable at that level and you will always look to ways to continue to optimize our capital structure. But as mentioned, as of 2019 -- for everything that we've announced in 2019, we are fully funded.

Robert Gutman -- Guggenheim Partners -- Analyst

Great, thanks. And one other if I can. Can you talk about, I think looking at the recurring revenue growth -- your organic recurring revenue growth, you faced some tough comps because very high numbers in the back half of '17. How should we think about that going forward?

John Doherty -- Chief Financial Officer

I'll also take that one. It's certainly where we're very confident and comfortable with where our growth has been. We've been solidly in the teens each quarter for nearly two years, and while we don't provide quarterly guidance, I think it is appropriate to give you little bit more on 2019, particularly given some of what we've said in the prepared remarks. We expect growth in 2019 to be a bit opposite of 2018. The 2018 first quarter year-over-year, we started about 17%, 18%, and we exited the year at just over 13%.

One of the factors was just -- for the most part, availability of space. Obviously we addressed this with our bond issue in the tap in 2018, and more recently with the increase to our RCF. So for 2019, I expect that we're going to exit the year at a higher year-over-year growth rate than we start, and with earlier in the year and this will give us a really good momentum and a full head of steam as we move into 2020.

Robert Gutman -- Guggenheim Partners -- Analyst

Great. Thank you very much.

Operator

Thank you. Our next question today is from the line of Jonathan Atkin from RBC Capital Markets. Your line is open.

Jonathan Atkin -- RBC Capital Markets -- Analyst

Thank you. So I was interested in the cross connect revenue trends, and maybe talk about just volume trends, pricing trends that might be coming into play in 2019, and the use cases around cross connects that might drive your growth this year and how they might be different if at all versus prior years. And then just a question about the utility prices in Europe, one of your peers mentioned that's higher and I wonder that's a trend that you're seeing as well and how that close into your operating metrics? Thanks.

David Ruberg -- Chief Executive Officer

Hi, Jonathan. I'm going to try and condense the question you asked or the elements of the question on cross connects and handle it in a following fashion. Given our consumer mix and given our application mix and what we're trying to accomplish with these customers on a long-term basis, we believe that our cross connects are appropriately priced at the present time. Do you have anything you want to add on?

Giuliano Di Vitantonio -- Chief Marketing & Strategy Officer

Jonathan -- This is Giuliano. Hi, Jonathan. You also asked about the use cases and I think David hinted that in the prepared remarks. In the past, the use case which is driving cross connect adoption was primarily the global carriers exchanging traffic among themselves. And in the last couple of years, with the roll out of cloud platforms (Technical Difficulty) going to the local ISPs, the local providers or connectivity in the countries and the traffic is originated by the platforms that distribute to the end user. So the use case has significantly shifted in the last couple of years. It speaks to that interplay between the content, the cloud and the connectivity that David referred to in his prepared remarks.

David Ruberg -- Chief Executive Officer

As far as energy prices in the last six months and in 2018 and going forward, although the cost of generating energy has not risen, the implication of what the European Union is trying to do through CO2 certificates has come to play a significant portion -- a significant part and has increased the cost of procuring energy, and you will see that that is part of what is impacted our gross margin in 2018, as well as 2019. So it's the CO2 emission certificates, not the demand and not the cost of generation. Did I answer your question?

Jonathan Atkin -- RBC Capital Markets -- Analyst

Yes. Thanks very much.

Operator

Thank you. Our next question is from Erik Rasmussen from Stifel. Your line is open.

Erik Rasmussen -- Stifel -- Analyst

Yeah, thanks for taking the questions. One, you mentioned on the cross connects and you're starting to see the 10 gig, the 100 gig sort of migration starting that now happened more in Europe. We've obviously seen that in the US market, but what kind of headwind are you expecting in 2019 and how do you see things progressing?

John Doherty -- Chief Financial Officer

Let me just put -- let me give you -- frame it out from a numbers perspective. Cross connects have continued -- revenue is continuing to grow at a rate higher than our overall growth rate. We still expect that to be the case in '19 over '18. So it's still an area of our business that's accretive to our overall growth. The issue is at 6%. I know there is an expectation that that number would move higher and higher in bigger increments. That's just not the case. We are -- it's a little bit of a different way in which it shows up in our revenues, ultimately it's growing, it's accretive and overall on a net basis.

Giuliano Di Vitantonio -- Chief Marketing & Strategy Officer

And Erik, this is Giuliano. From a customer adoption standpoint, the transition to -- from 10 to 100 gig is going to happen in a gradual way. It would be primarily some new applications that will drive that adoption and the roll out of new equipment. So we don't fall over a number of years, and during that period, the volume of traffic is expected to grow really substantially. Some studies indicate 37% CAGR for the growth of the peak traffic, which is how you dimension your network. So we believe that in terms of headwind, we're not going to see any significant impact because of the high volume of traffic which compensate for the fact that we have a higher bandwidth.

Erik Rasmussen -- Stifel -- Analyst

Great, thanks. And then, in terms of, you mentioned this 10 new on-ramps in it's accelerated since August. Can you talk about how many -- what the total is that you have now and can you comment on how you see things -- the impact of this on your overall business, just to give us some context there?

Giuliano Di Vitantonio -- Chief Marketing & Strategy Officer

Yeah, I don't have the total number off the top of my head. I believe it's close to 40, 50, but I would come back to you with a precise number. So in terms of the impact on the business, it clearly drives demand for cloud connect, but also enterprise, it would start with a small deployment just to connect to the cloud, and then the business evolves and the requirements grow, they keep expanding and adding more racks. So it's the catalyst for our new enterprise to come to us and we have a steady trickle of new enterprises come to us, but also provides a foundation for those enterprises to grow.

David Ruberg -- Chief Executive Officer

It is the foundation for us building a community. It's the same way we built this on the international carriers and eventually migrated that concentration to collect the enterprises that wanted to use them and then the ISPs that wanted to do the customer facing. So as we go forward, these on and off ramps, these edge nodes are what drive the stickiness of our communities of interest.

Erik Rasmussen -- Stifel -- Analyst

Great. Thank you.

Operator

And your next question today is from Nate Crossett from Berenberg. Your line is open.

Nate Crossett -- Berenberg -- Analyst

Hi, thank you. I was wondering if you could give us the level of pre-leasing among the expansions. I don't think you guys disclosed that this quarter or last quarter, and if it's not something you want to disclose, maybe can you talk about how the indications are coming along for some of the bigger projects?

David Ruberg -- Chief Executive Officer

Okay. I may get myself in trouble here. We haven't disclosed this for a while and I'll tell you why, I think because the industry focus is too much on this. These numbers have become lumpy. They're really dependent upon the book-to-bill ratio, which never gets factored into them. And given where we are with our customers and their applications, we have most of the customers we want. They're in our communities. They're in our campuses and we have a very good relationship with them and so we have a very good understanding or a very good idea of what the growth rate looks like, because we sell them energy, and they are all very open with us and it makes it very predictable. So rather than giving, the industry has changed over the last couple of years and now that we have them and we have a great relationship with them where actually in many cases doing joint planning in terms of space, land, and things like that. So we have not revealed either bookings or pre-leasing, because I personally believe that the industry is focused on this. All right.

Nate Crossett -- Berenberg -- Analyst

Okay. Yeah, that's fine. And one more if I could. I wanted to get an update on maybe a potential investment grade rating, kind of, in light of the recent Equinix equity deal in conjunction with their investment grade rating the following day. Do you think that the Equinix developments kind of pave the way for you guys to get investment grade sooner, given that you kind of have similar leverage levels and property ownership levels?

John Doherty -- Chief Financial Officer

The short answer is, we certainly have that as a goal, but it's a bit of a medium-term goal. To go through and do a straight comparison to one of our peers that you mentioned. We take a bit longer than we have on this call, but effectively we are comfortable with our leverage and where we are now, we're comfortable with the prospects we have in front of us over time. That's definitely something that we'd like to go after. But it's -- as I said, it's bit more of a medium term goal.

David Ruberg -- Chief Executive Officer

I may puts this in a little bit of context. This is a capital-intensive business. We are highly focused on returns. We try to get the best customers, the best prices at a lowest cost to construction and capital is really important, and so we have been focused for a long time on reducing our cost to debt.

Nate Crossett -- Berenberg -- Analyst

Okay. That's helpful. Thanks.

Operator

Your next question today is from Sami Badri from Credit Suisse. Your line is open.

Sami Badri -- Credit Suisse -- Analyst

Hi, thank you. My question really has to do with something David commented on toward the end of the prepared remarks and has a lot to do with that mix of enterprises and making up about one-third of total revenues in your ecosystem. When do you think there will be an inflection change where maybe that one-third goes up more, say, to net of about 40% of your revenues for our total ecosystem constituents. Can you give us an idea when the European region will start to inflect faster faster? And as this inflection occurs, will this be the engine that drives the interconnection revenue mix higher, just looking at an idea on how to visualize the Company's results over the next two years?

David Ruberg -- Chief Executive Officer

Okay. Sami, as you know, I don't answer modeling question. So this is the $64,000 question. This has changed. We originally thought it would be precipitated by what was coming from the United States, that's not the case. So what we've seen happen is people close to their corporate headquarters of which quite a few here in Europe, began to experiment with it.

The second question that you asked is easier to answer. Yes, this will certainly drive the interconnection business, because most of these applications that will stick with us are communication sensitive, response time sensitive and customer focusing. So I don't expect it to happen, this is just me personally. We're not expecting it to happen for the next couple of years in terms of the inflection point, but we are beginning to see more in Europe than we thought we were going to see. Do you want to add anything to that?

John Doherty -- Chief Financial Officer

Yeah. As we mentioned earlier, Sami, it's more of a gradual adoption at this point. So we are seeing that increase, of course, enterprise is growing as well. So enterprises are going through this migration. It's the migration that takes time, it requires -- it involves transforming their IT organization, their networking infrastructure. So it's something that is happening over a period of time. And so as David mentioned, it's unlikely in the next couple of years we will seen an inflection point, but we will certainly continue to see the growth that we've seen at least in 2018.

Sami Badri -- Credit Suisse -- Analyst

Got it. Thank you for the color on that. And then my next question has to do with the ARPU which connect to EUR411 to EUR414 for the year. Now, as we think about specifically that range, and you commented early on this call that your initial guidance could be concerted relative to the -- in the final year results. Which market do you think will drive positive surprise relative to this EUR411 to EUR414 ARPU?

David Ruberg -- Chief Executive Officer

I'm not sure we heard your question. The lines were garbled, but did you ask what markets do we expect to see pleasant surprises in the ARPU developments? Is that the essence of your question?

Sami Badri -- Credit Suisse -- Analyst

Yeah, that's right.

John Doherty -- Chief Financial Officer

Let me jump in, I guess, maybe it's an interesting question, I appreciate it. But I'm not sure if I would conclude looking at the business that way, because obviously in some markets, when we deploy more capital, more space, there is more opportunity for growth that can ultimately have some impact on that number. So it's a positive surprise in that market. I mean, effectively, what we told you, we expected to be stable. We're really comfortable with that, and I think that's pretty much good for now.

David Ruberg -- Chief Executive Officer

Just in a general observation, we try not to be surprised too much by anything up or down. So maybe there's more color to your question that we can address later, but we are giving you best bet in terms of the aggregate amount over the company, OK.

Sami Badri -- Credit Suisse -- Analyst

Thank you.

Operator

Thank you. And our next question is from Colby Synesael from Cowen & Company. Your line is open.

Michael -- Cowen & Company -- Analyst

Hi, this is Michael on for Colby. First, the implied CapEx per square meter at the midpoint of 2019 guidance is around EUR24,000 versus EUR20,000 in the past two years. Are you seeing an increase in build costs, and if so, what's driving this? And then secondly, we appreciate you don't want to discuss the percentage of space coming online, it's pre-lease, but any color on where you expect utilization rates to be by year-end would be great? Thank you.

David Ruberg -- Chief Executive Officer

Okay. The primary -- we're not seeing an increase in the costs and actually you referenced it per square meter. But part of what's happening is the density is going up per square meter. So it's really on a kilowatt basis, that's one.

Two, most of these that we're acquiring now include the land purchase prices. Over the years, we've started to buy more land, larger land. So, no real increase in the construction cost as a matter of fact, because we can build bigger and build -- and design more consistently on a per unit cost, which we look on a per kilowatt basis is actually coming down. And the second part of his question is, do you ...

John Doherty -- Chief Financial Officer

Utilization rate...

David Ruberg -- Chief Executive Officer

Approximately the same.

John Doherty -- Chief Financial Officer

Yeah.

Michael -- Cowen & Company -- Analyst

Thank you very much.

Operator

Thank you. And your next question is from the line of Tim Horan from Oppenheimer. Your line is open.

Timothy Horan -- Oppenheimer -- Analyst

Thanks guys. Dave, do you think you're gaining share versus your peers and is it kind of a stated goal of yours. And just secondly, do you think CapEx is going to remain fairly elevated for a few years of demand will remain the strong for a few years? Thanks.

David Ruberg -- Chief Executive Officer

Okay. Market share is an interesting thing, it depends upon what markets, sub-market you're going after. I think as Giuliano pointed out, we kind of hinted with the number of network nodes that we're going after. I think we've done a really good job, where we look at the type of business we want, we've certainly maintained market share and we probably added to the market share, OK. We don't base it on square meters, we don't base it on kilowatts, we base it on how we're going to position ourselves for the maximum value long-term. So I think, yes, we have.

And in terms of CapEx, we are very disciplined in how we do it, it is based on the returns. And if the returns continue to be where they are, and we believe they will be, we will find a way to deploy -- acquire and deploy capital to meet that demand and generate the same returns.

Timothy Horan -- Oppenheimer -- Analyst

And on the share gains, do you think it's helping you, that you're more European focused and maybe your cross connect prices are a little lower than peers or anything else that you're doing that's helping gain share?

David Ruberg -- Chief Executive Officer

I think what helps us gain share is the fact that we've had a consistent go-to-market strategy for the last forever number of years and our customers recognize this and it is our customer focus, focus on what's best for the customers, understand what the customers want, try to anticipate what the customers want, enter into a -- everything that we do starts with customer focus that I think is a differentiator.

We certainly didn't have the biggest balance sheet, we didn't have presence in the United States, we weren't there when these cloud guys started, they are all in United States. We had to do something different, because the big guys are indeed in Europe, they are in the United States. It's something we did different, not just our presence that has led us to be successful and I think it goes to what we've said many times. We have a very consistent go-to-market strategy. We try to anticipate where this is rather than fall behind and follow them.

Timothy Horan -- Oppenheimer -- Analyst

Thank you.

Operator

Your next question is from James Breen from William Blair. Your line is open.

Eric -- William Blair -- Analyst

Hi, this is Eric. The first question is about the accounting change. I'm just wondering if you could quantify how much of the 600 basis points margin expansion in 2018 was due to reduced rent expense and how much of that goes to the increased depreciation charge. And then secondly, if you could just talk about the competitive environment, and have you seen any changes over the course of last six months or so? Thank you.

John Doherty -- Chief Financial Officer

Yeah, I'll take the first part and I hand it over to David for the second. So the first part of the 600 basis points, applied across all of our leases, which primarily all of them were related to rent, so well over 90%. And then if you look going forward, it's kind of a modeling question. I'm not going to violate David's principle of answering the modeling question, but effectively, what I would look at is we're somewhere around -- the split would be somewhere around 75% depreciation, 25% interest.

Eric -- William Blair -- Analyst

Okay. Great.

John Doherty -- Chief Financial Officer

By the way, John, you can answer the modeling questions. I'm just not qualified.

David Ruberg -- Chief Executive Officer

Now, I forgot (multiple speakers). I think if you look at -- you don't need to ask me the question about the changing competitive environment, you just need to look at our results and compare it to our competitors' results for the fourth quarter and that speaks a whole lot louder than anything I could say. Okay.

Eric -- William Blair -- Analyst

Okay, thank you.

Operator

And our final question today is from Frank Louthan from Raymond James. Your line is open.

Frank Louthan -- Raymond James -- Analyst

Great. Thank you very much. Talk to us a little bit about capital. Some of your peers of using some joint ventures to raise capital and discuss if you looked at that. And then, what's been the impact of infrastructure funds, I'm looking to back data centers in your markets. Have you seen any pricing impact from that? Thank you.

John Doherty -- Chief Financial Officer

I'll take that one, Frank, and I'm sure David may add some comments. It's no mystery that there is a significant amount of capital available from private sources, the infrastructure funds as you mentioned, but also sovereign wealth funds seeking to access this market. I think one thing to note there is because of how attractive this market is and ultimately steady cash, steady revenue growth, solid returns. And as you know, we've seen a number of these examples in the market, some of our peers have done that.

However, you need to look at what is behind some of this. Some of these initiatives are driven by some of the operators that understandably are seeking to avoid slowing growth rates and diminishing returns. We do not have that problem and these JVs are not without their challenges around asset contribution structure, particularly from a tax perspective, how you split the return. Our focus really needs to continue to stay on executing on the strong organic and consistent margin opportunities that are out in front of us, over the next few years to continue to drive the value for our shareowners.

Now, yeah, we say, some of the private guys are also playing in what I'll call the transactional market, the M&A market, and that's having a little bit of impact on the values of some of these assets, also I think helping a little bit in the public markets as well. From a competitive perspective across Europe, we're really not seeing any major impact whatsoever.

David Ruberg -- Chief Executive Officer

We -- our business is based on value proposition, not necessarily cost proposition. So we -- you see in United States, quite a few new entrants into the wholesale market, because that is for those customers that are getting -- using those services, they want the lowest cost of service. That is not the business that we're in. And as we pointed out, the barriers to entry are substantially more difficult in this colocation business, the returns are different and therefore we do not see the sovereign wealth funds or the infrastructure people entering into our type of business like they might for those that are just real estate oriented.

Frank Louthan -- Raymond James -- Analyst

Great. Thank you much.

Jim Huseby -- Investor Relations

That concludes our fourth quarter earnings conference call. Thank you all for joining us. We expect to see many of you guys out on the road over the next several weeks, and we expect our first quarter results available in early May. Thank you very much, and you may disconnect.

Operator

Thank you. That does conclude the webcast for today. Thank you all for participating. You may now disconnect.

Duration: 63 minutes

Call participants:

Jim Huseby -- Investor Relations

David Ruberg -- Chief Executive Officer

John Doherty -- Chief Financial Officer

Robert Gutman -- Guggenheim Partners -- Analyst

Jonathan Atkin -- RBC Capital Markets -- Analyst

Giuliano Di Vitantonio -- Chief Marketing & Strategy Officer

Erik Rasmussen -- Stifel -- Analyst

Nate Crossett -- Berenberg -- Analyst

Sami Badri -- Credit Suisse -- Analyst

Michael -- Cowen & Company -- Analyst

Timothy Horan -- Oppenheimer -- Analyst

Eric -- William Blair -- Analyst

Frank Louthan -- Raymond James -- Analyst

More INXN analysis

Transcript powered by AlphaStreet

This article is a transcript of this conference call produced for The Motley Fool. While we strive for our Foolish Best, there may be errors, omissions, or inaccuracies in this transcript. As with all our articles, The Motley Fool does not assume any responsibility for your use of this content, and we strongly encourage you to do your own research, including listening to the call yourself and reading the company's SEC filings. Please see our Terms and Conditions for additional details, including our Obligatory Capitalized Disclaimers of Liability.